
 Help
Help Bitcoin rallies as Trump intensifies support for crypto assets
Bitcoin surged 5% to $72,761 as US President Donald Trump urged Congress to pass the Clarity Act. Market optimism was further buoyed by a new regulatory proposal from the Securities and Exchange Commission (SEC) aimed at streamlining token issuance.

US President Donald Trump has urged Congress to pass the Clarity Act to establish a clear regulatory framework for digital assets.
Potential conflicts of interest surrounding the Trump family's crypto ventures are introducing legislative uncertainty in Congress.
A streamlined token-issuance proposal from the SEC has strengthened institutional confidence, helping drive recent market gains.
Date: 20 August 2026
Bitcoin gains momentum amid renewed Trump backing for cryptocurrencies
According to a Reuters report, US President Donald Trump has called on Congress to pass a fair version of the Clarity Act—a legislative proposal seeking clearer statutory rules for cryptocurrencies and their oversight bodies. In this context, the Clarity Act aims to establish whether digital tokens should be classified as securities or commodities. This distinction is critical, as clarification would inform market participants whether digital assets fall under the jurisdiction of the Securities and Exchange Commission (SEC)—if designated as securities—or the Commodity Futures Trading Commission (CFTC), if treated as commodities.
However, while Trump’s backing of digital assets has provided price support, potential conflicts of interest are being scrutinised by US lawmakers, given that political analysts note Trump and his family have benefited directly from cryptocurrency ventures. This generates concerns surrounding the proposal’s legislative path, particularly as Congress faces a constrained legislative calendar to reach a decision.
At market close, Bitcoin rose 5% to $72,761, extending its cumulative gains to 15% over four consecutive trading sessions. Digital assets were further propelled by an SEC proposal outlining a new regulatory framework designed to simplify token issuance and capital raising for crypto firms. Released by the regulator earlier this week, the initiative has been positively received by market participants, reinforcing confidence primarily among institutional investors.
Notably, the Bitcoin Volmex Implied Volatility (BVIV) index—which measures the 30-day forward-looking implied volatility of Bitcoin based on real-time option flows—has risen by approximately 12%. Because the BVIV index typically advances during periods of heightened market activity, irrespective of whether sharp price movements are positive or negative, this elevation suggests that the current price action in Bitcoin possesses underlying momentum that could prove sustainable over time.
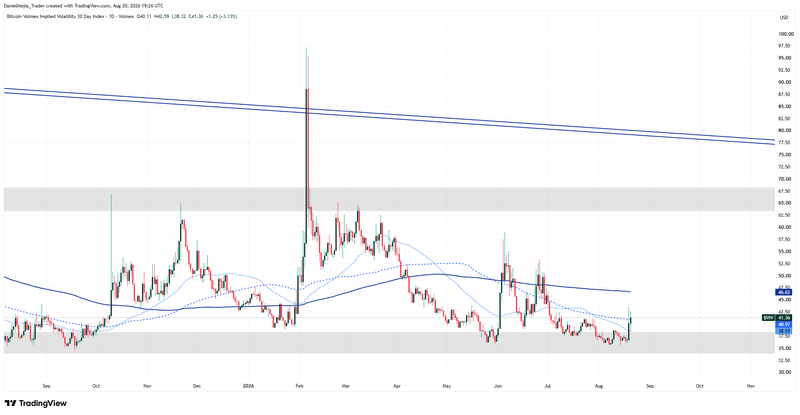
Figure 1. Bitcoin Volmex Implied Volatility (BVIV), 2025–2026. Source: Own analysis conducted via TradingView.
Technical analysis of Bitcoin
From a technical perspective, Bitcoin remains bound within an overarching downtrend, although short-term price action demonstrates strong bullish momentum. A detailed examination of the current market structure yields several key technical observations:
- Trend Context: On daily timeframes, Bitcoin has reclaimed its 50-day, 100-day, and 200-day Simple Moving Averages (SMAs), reflecting renewed buying pressure. This market reaction suggests a potential structural price recovery, supported by volume indicators that reinforce the underlying upward momentum.
- Resistance Levels: Should short-term bullish momentum persist, the primary overhead resistance levels are the psychological $80,000 threshold and the structural pivot point near $82,500. A decisive close above $82,500 would effectively invalidate the broader downtrend and signal potential for a wider structural recovery.
- Support Levels: In the event of a retracement, primary structural support sits at $63,200, followed by a secondary technical floor near $58,300. A sustained breakdown below $58,300 would significantly increase the probability of a deeper market correction.
- Momentum Indicators: Both the Moving Average Convergence Divergence (MACD) and the Relative Strength Index (RSI) display positive momentum, suggesting that short-term upside movement could continue. Notably, the MACD is executing a bullish zero-line crossover, strengthening this hypothesis. However, the RSI is entering overbought territory, which suggests caution as short-term momentum could experience temporary exhaustion.
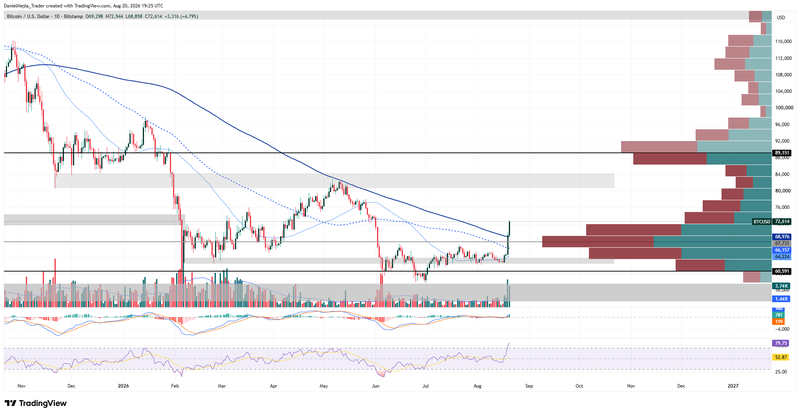
Figure 2. Bitcoin’s Price (2025–2026). Source: Own analysis conducted via TradingView.


