
 Help
Help Cardano tests key resistance as rising inflation pressures weigh on digital assets
Cardano fell 6.03% to $0.239 as surging oil prices and rising bond yields fuelled inflationary fears, although short-term technical indicators point to bullish momentum as the asset tests key resistance.

Cardano dropped 6.03% to $0.239 amid rising inflationary pressures that could prompt a more restrictive policy stance from the Federal Reserve.
Brent crude reached $103.08 per barrel and 10-year US Treasury yields surged to 5.11%, boosting market-implied probabilities of a Fed rate hike.
Higher yields could drive capital reallocation from cryptocurrencies into government bonds, which offer more attractive risk-reward profiles.
Date: 24 September 2026
Could Cardano break key resistance amid rising inflationary pressures?
Cardano's price recorded a sharp daily decline of 6.03%, falling to $0.239. This downturn was primarily driven by rising oil prices, which heightened concerns over inflationary pressures, alongside technical selling pressure as the cryptocurrency tested a robust resistance level.
At market close, the Brent crude futures contract (BRNX6) advanced by 3.86% to $103.08 per barrel, while the West Texas Intermediate (WTI) futures contract (CLX6) rose by 2.00% to $92.22 per barrel. Against this backdrop, data from the CME FedWatch Tool indicates a market-implied probability of approximately 72% that the Federal Reserve will implement an interest rate hike at its October meeting.
Additionally, 10-year US Treasury yields jumped by 15.5 basis points to 5.11%, reaching their highest level since 2007. This reflects intensifying selling pressure among bondholders who are pricing in further monetary policy tightening by the Federal Reserve, amidst an environment where headline inflation remains considerably above the central bank's 2% target.
An environment of higher interest rates typically weighs on cryptocurrencies, as market participants rotate out of risk assets and into sovereign bonds in search of more favourable risk-adjusted returns.
Nevertheless, Cardano is currently testing a critical long-term technical level, which could signal a significant price recovery if broken to the upside. Although Cardano has not been among the primary gainers during the recent bullish momentum across the altcoin market, it has nonetheless accumulated an appreciation of approximately 56% over the past three months.
Technical analysis of Cardano
From a technical perspective, Cardano has exhibited a long-term bearish trend, although it is currently signalling an upward structural shift. Key technical observations include:
- Trend context: On longer timeframes, Cardano maintains a market structure defined by lower highs and lower lows. In the short term, however, it has reclaimed its 50-day, 100-day, and 200-day Simple Moving Averages (SMAs) and is trading above these key technical benchmarks. Price action currently displays solid bullish momentum as it tests a pivotal level that acts as a strong resistance zone within the broader structure.
- Resistance levels: If the immediate resistance near $0.255 is breached to the upside, the next major technical barrier lies at $0.30, with a secondary resistance standing at $0.40. A decisive move above these key levels would increase the likelihood of further upward revaluation.
- Support levels: Should the price undergo a retracement, two significant support levels are situated at $0.215 and $0.205, representing key technical floors within the short-term bullish structure. A sustained break below these levels would heighten the risk of a deeper downside correction.
- Momentum indicators: Both the Moving Average Convergence Divergence (MACD) and the Relative Strength Index (RSI) are tracking an upward trajectory, suggesting that short-term bullish momentum may persist. Nevertheless, the RSI nears overbought territory, signalling caution regarding the sustainability of the upward move.
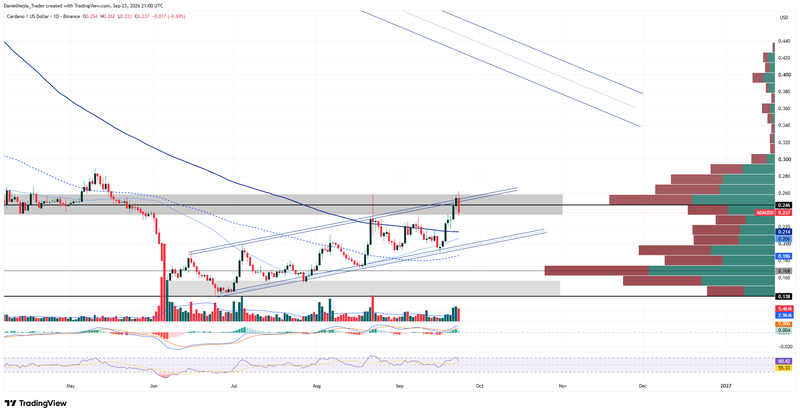
Figure 1. Cardano Price (2025–2026). Source: Data from Binance Exchange; author's analysis conducted via TradingView.


