Ethereum falls sharply amid geopolitical uncertainty and hawkish Fed expectations
Geopolitical conflicts and rising oil prices are fuelling inflation fears, driving Ethereum down 6.15% to $1,854. A resilient US labour market and hawkish Fed commentaries suggest higher-for-longer interest rates. This macroeconomic pressure, coupled with a 15% spike in implied volatility, accelerates capital flight toward defensive assets.

Escalating Middle East tensions pushed Brent crude to $96.06 and WTI to $93.54, intensifying global inflation risks and market-wide risk-off sentiment.
Surging US JOLTs job openings (7.62M) and hawkish comments from Fed official Beth Hammack fuel expectations of a highly restrictive monetary policy stance.
Investors are fleeing high-risk crypto assets for the attractive yields of US Treasuries, triggering a sharp 6.15% drop in Ethereum to $1,854.
Under its 50, 100, and 200-day SMAs, Ethereum tests the $1,800 floor; a breach risks a deeper correction amid a rising 15% EVIV volatility index.
Geopolitical uncertainty and rising oil prices trigger sharp Ethereum sell-off
Geopolitical uncertainty continues to depress the cryptocurrency market via two primary transmission channels: mounting concerns that the US-Israel-Iran conflict in the Middle East could persist, and rising expectations that the Federal Reserve will implement an increasingly restrictive monetary stance to counteract renewed inflationary pressures.
Energy markets are continuing to exert upward pressure on inflation expectations. At the market close, the Brent crude futures contract (BRNQ6) advanced by 1.15% to settle at $96.06 per barrel, while the West Texas Intermediate (WTI) futures contract rose 1.81% to finish at $93.54 per barrel. Concurrently, US employment indicators have demonstrated renewed structural strength. According to data released by the US Bureau of Labour Statistics (BLS), the JOLTs Job Openings metric surged from an upwardly revised 6.89 million positions in March to 7.62 million in April, substantially outperforming analyst consensus forecasts of 6.88 million. This print represents the highest level for the indicator since November 2024, signalling robust resilience in the United States labour market.
Furthermore, a Reuters report highlighted comments from Cleveland Federal Reserve President Beth Hammack, who noted that the central bank may need to raise interest rates soon if inflationary pressures persist. The Fed official emphasized that her primary focus remains directed at sticky inflation rather than employment data, the latter of which has shown a marginal recovery over recent readings.
A macroeconomic climate defined by geopolitical instability and elevated interest rates traditionally weighs heavily on the cryptocurrency ecosystem. Under these conditions, market participants routinely liquidate high-beta risk investments to seek refuge in defensive assets, such as US Treasury bonds, which offer highly competitive risk-free yields. Consequently, Ethereum suffered a sharp depreciation of 6.15%, closing at $1,854 and closing in on its short-term structural support at $1,800. Compounding this bearish outlook, the Ethereum Volmex Implied Volatility (EVIV) index rose aggressively by 15%, suggesting that downward market momentum may have further room to run.
Technical analysis of Ethereum
From a technical perspective, Ethereum maintains a distinct downward trajectory. A detailed breakdown of the current market structure reveals several key observations:
- Trend Context: Within a long-term framework, Ethereum continues to trade beneath its 50, 100, and 200-day Simple Moving Averages (SMAs). This sustained positioning below major moving averages reinforces the prevailing bearish market sentiment.
- Resistance Levels: Should immediate psychological resistance near the $2,000 threshold be breached to the upside, the primary technical ceiling is identified at $2,380. Reclaiming this structural pivot point is considered a prerequisite for re-establishing a sustained bullish trend.
- Support Levels: If the immediate support at $1,800 is compromised, the next critical floor resides at the $1,500 mark, which represents a prominent historical structural support area. A sustained close beneath this threshold would likely intensify selling pressure and significantly heighten the probability of a more profound market correction.
- Momentum Indicators: The Moving Average Convergence Divergence (MACD) indicator is currently crossing below its zero line and maintaining a downward slope, suggesting that bears retain control over price action. Conversely, the Relative Strength Index (RSI) is trading deep within the oversold zone, indicating that while the trend is aggressively bearish, traders should exercise near-term caution regarding potential oversold bounces.
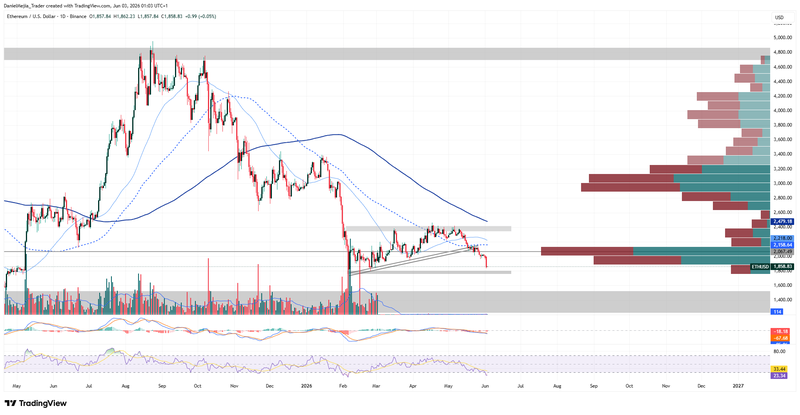
Figure 1. Ethereum Prices (2025–2026). Source: Data from the Binance Exchange; Own analysis conducted via TradingView.


