
 Help
Help Ethereum strengthens as Fed rate outlook turns less restrictive
Ethereum rose 1.90% to $1,906 as weak US labour market data softened Federal Reserve rate hike expectations. Technical indicators reflect growing bullish momentum despite the asset maintaining a broader downward trend.

US private sector job growth decelerated to 44,000 in July, and the ISM services employment sub-index contracted, easing market bets on further monetary tightening.
The CME FedWatch Tool indicates that the market-implied probability of a September Fed rate hike has dropped to 54.4%.
Ethereum remains in a long-term bearish posture as it trades beneath its 200-day Simple Moving Average, although short-term momentum indicators suggest a rising bullish impulse.
Date: 5 August 2026
Ethereum moves higher as cooling hawkish Fed expectations support risk assets
Ethereum prices advanced by 1.90% to $1,906 amid cooling expectations that the Federal Reserve will adopt a more restrictive monetary stance at its upcoming meeting.
According to data released by Automatic Data Processing (ADP) Inc., private-sector employment growth in the United States decelerated sharply from a revised 95,000 in June to 44,000 in July, missing the consensus analyst forecast of 70,000. Meanwhile, the Institute for Supply Management (ISM) published its US Services PMI, which edged up from 54.0 in June to 54.1 in July, indicating a slight expansion in overall activity. However, the employment sub-index—a key component of the ISM services survey—dropped from 51.2 to 47.4 points, moving into contraction territory.
Consequently, both economic indicators point to emerging weakness in the US job market ahead of the official non-farm payrolls and unemployment rate report to be released by the Bureau of Labour Statistics (BLS) this Friday.
In this macroeconomic context, the CME FedWatch Tool showed that the market-implied probability stood at 54.4% for a 25-basis-point interest rate hike at the Federal Reserve’s September meeting. This probability has declined compared to recent sessions, when the likelihood approached approximately 57%. In contrast, the implied probability of rates remaining unchanged rose to 45.6%.
Cryptocurrencies have faced ongoing headwinds from hawkish Federal Reserve expectations, as elevated real yields in the bond market reduce the relative attractiveness of non-yielding risk assets. Consequently, Ethereum tends to respond positively whenever interest rate expectations shift back towards a dovish or neutral stance.
Technical analysis of Ethereum
From a technical perspective, Ethereum maintains a well-defined downward trajectory across extended timeframes. A detailed assessment of the current market structure reveals several key observations:
- Trend Context: Ethereum continues to exhibit a broader downward bias, with the spot price trading beneath its 100-day and 200-day Simple Moving Averages (SMAs). This alignment reinforces a multi-month structure characterised by lower highs and lower lows.
- Resistance Levels: Should immediate psychological resistance near the $2,000 threshold be decisively breached to the upside—a level that converges with the descending 200-day SMA—the primary technical ceiling is identified at $2,400. Reclaiming this structural pivot point remains an essential prerequisite for buyers to re-establish sustained upward momentum.
- Support Levels: If short-term support at $1,800 is invalidated, the next critical floor lies at the $1,500 mark, representing a highly significant psychological boundary and long-term structural support. A sustained close below this threshold would likely intensify liquidation pressure and significantly increase the probability of a deeper market correction.
- Momentum Indicators: Both the Moving Average Convergence Divergence (MACD) and the Relative Strength Index (RSI) display upward trajectories, suggesting that underlying bullish momentum could persist in the near term. Nevertheless, price discovery will remain heavily dependent on the surrounding macroeconomic and geopolitical background.
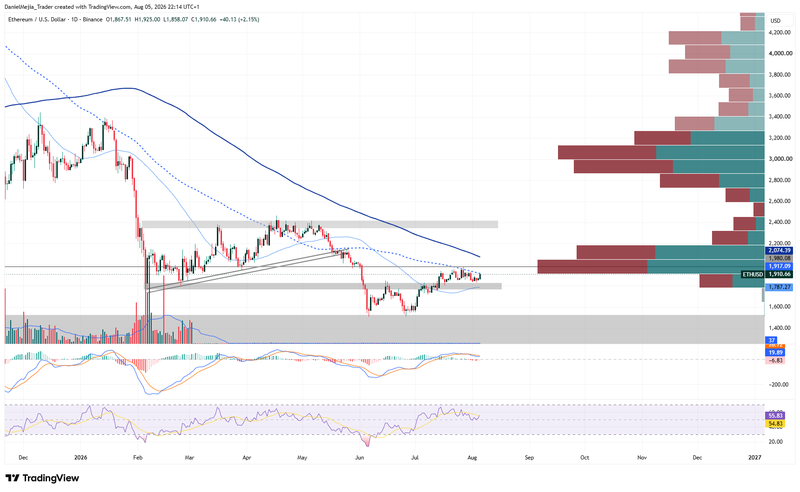
Figure 1. Ethereum’s Price (2025–2026). Source: Data from the Binance Exchange; own analysis conducted via TradingView.


