Help
Help Ethereum strengthens as softer US inflation boosts risk appetite
Ethereum surged by 6.61% as softer US inflation reduced expectations of aggressive Federal Reserve tightening. Improving technical signals and a potential double-bottom pattern reinforced optimism, supporting stronger investor demand for risk assets.

Ethereum rose by 6.61% to $1,891 as slowing US inflation increased appetite for cryptocurrencies.
US CPI eased to 3.5%, reducing expectations of aggressive Federal Reserve tightening and supporting market sentiment.
The implied probability of a September rate hike fell to 50%, while the probability of rates remaining unchanged in July rose to 84.5%, easing pressure on crypto markets.
A potential double-bottom pattern, bullish MACD divergence, and a rising RSI support Ethereum’s recovery prospects.
Ethereum strengthens amid lower US inflation
Ethereum gained bullish momentum, rising by 6.61% to close at $1,891 and recording one of the strongest performances in the cryptocurrency market during the session. The solid advance can be explained, to some extent, by reduced expectations that the Federal Reserve will adopt a more restrictive monetary policy stance after US inflation showed a significant deceleration. Expectations of less restrictive interest rates tend to support high-risk assets, as the prospect of stronger returns becomes more attractive to investors seeking exposure to cryptocurrencies.
According to data released by the US Bureau of Labor Statistics, the annual headline inflation rate slowed from 4.2% in May to 3.5% in June, coming in below market expectations of an easing to 3.8%. As a result, the CME FedWatch Tool showed a moderation in market-implied expectations of further monetary tightening. The probability of an interest rate increase at the Federal Reserve’s September meeting stood at 50%, remaining the most likely scenario but declining from levels above 70% recorded only a few days earlier. For the Fed’s July meeting, the probability of interest rates remaining unchanged reached 84.5%, reinforcing expectations that policymakers may adopt a more cautious approach in the near term.
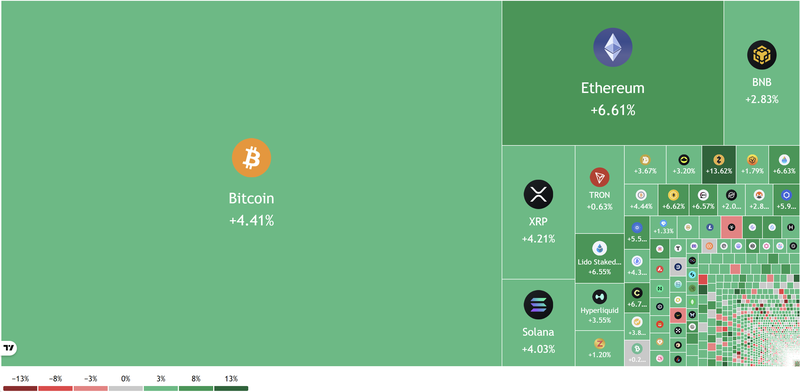
Figure 1. Crypto Coins Heatmap, 14 July 2026. Source: Figure obtained from TradingView.
In addition, Ethereum’s price action had already been signalling a recovery in momentum indicators, while a short-term double-bottom pattern appeared to be forming. This technical structure is commonly associated with potential upward price reversals, particularly when accompanied by improving market sentiment. Therefore, the combination of softer inflation data, reduced expectations of aggressive Fed tightening, and a more constructive technical setup helped to support Ethereum’s strong rebound during the session.
Technical analysis of Ethereum
From a technical perspective, Ethereum maintains a well-defined downward trajectory over an extended timeframe. A detailed assessment of the current market structure reveals several key observations:
- Trend context: Ethereum continues to exhibit a broader downward bias, with the spot price trading comfortably below its 100-day and 200-day Simple Moving Averages (SMAs). This alignment reinforces the multi-month structure of lower highs and lower lows. However, while the overarching trend remains within this bearish regime, short-term momentum oscillators are beginning to develop an upward profile, while a double-bottom technical pattern may be consolidating.
- Resistance levels: Should the immediate psychological resistance near the $2,000 threshold be decisively breached to the upside, the primary technical ceiling would be identified at $2,380. Reclaiming this structural pivot point would be an essential prerequisite for market bulls to re-establish sustained upward momentum.
- Support levels: If the long-term structural support at $1,500 is invalidated, the next critical floor would lie at the $1,000 mark—a highly significant psychological boundary. A sustained close below this threshold would likely intensify liquidation pressure and significantly increase the probability of a deeper and more prolonged market correction.
- Momentum indicators: The Moving Average Convergence Divergence (MACD) indicator exhibits a bullish divergence from price action, implying that a near-term price recovery may be materialising. Concurrently, the Relative Strength Index (RSI) is following an upward trajectory from lower levels, suggesting that underlying bullish momentum could re-emerge. Nevertheless, near-term price discovery will remain heavily dependent on how the evolving macroeconomic and geopolitical environment develops.
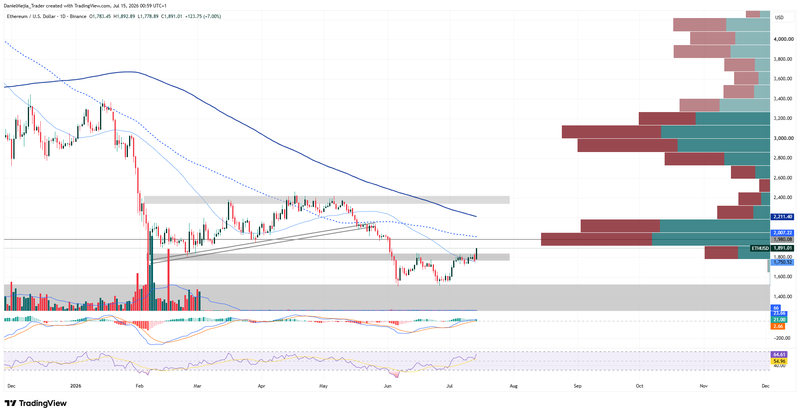
Figure 2. Ethereum Prices (2025–2026). Source: Data from the Binance Exchange; own analysis conducted via TradingView.