Help
Help Geopolitical tensions weigh on Ethereum as it nears key technical resistance
Renewed geopolitical tensions in the Strait of Hormuz have pressured Ethereum downwards, pulling the cryptocurrency to the $1,774 mark.

Recent tanker attacks in the Strait of Hormuz have severely strained the fragile US-Iran ceasefire, significantly diminishing investor appetite for risk-on assets.
Ethereum continues to trade below its major Simple Moving Averages (SMAs), maintaining a long-term bearish structure defined by a sequence of lower highs and lower lows.
Despite the prevailing macro pressures, a budding double-bottom pattern alongside psychological resistance at $2,000 could serve as a pivotal turning point for the trend.
Bullish divergences on both the MACD and the RSI indicate that short-term upward momentum may re-emerge across Ethereum’s prices.
Ethereum retreats amid geopolitical uncertainty, approaching a critical technical level
Ethereum has come under notable selling pressure following a resurgence of geopolitical volatility in the Strait of Hormuz, casting doubt on the durability of the current ceasefire agreement between the United States and Iran. At the market close, the second-largest cryptocurrency by market capitalisation had declined by 1.47% to settle at $1,774. According to a Reuters report, Qatar has directly accused Iran of being linked to attacks involving commercial tankers transiting the strategic maritime corridor. Concurrently, US officials have reiterated that a comprehensive, permanent agreement must be reached with Tehran, warning that Washington remains prepared to take further military action. This rhetoric has substantially heightened anxieties over a potential escalation of regional hostilities.
These developments have introduced deep uncertainty regarding the performance-based ceasefire between the US and Iran, creating a distinctly unfavourable environment for risk-sensitive assets. Financial markets typically adopt a risk-averse posture in response to sudden geopolitical instability. In such climates, institutional and retail investors routinely reduce their exposure to high-beta instruments—including cryptocurrencies—and reallocate capital toward traditional safe-haven assets. Consequently, the digital asset market remains acutely vulnerable to sharp shifts in global risk sentiment, particularly when geopolitical events threaten critical global trade routes, energy prices, and broader macroeconomic stability.
Despite the recent downward trajectory, Ethereum's near-term technical structure continues to hint at the possibility of a short-term recovery. As the asset approaches a critical structural zone, price action appears close to validating a double-bottom formation—a classic chart pattern historically associated with potential trend reversals.
Technical analysis of Ethereum
From a technical perspective, Ethereum maintains a well-defined downward trajectory over an extended timeframe. A detailed assessment of the current market structure reveals several key observations:
- Trend Context: Ethereum continues to exhibit a broader downward bias, with the spot price trading comfortably below its 50-day, 100-day, and 200-day Simple Moving Averages (SMAs). This alignment reinforces the multi-month structure of lower highs and lower lows. However, while the overarching trend remains trapped within this bearish regime, short-term momentum oscillators are beginning to construct an ascending profile.
- Resistance Levels: Should immediate psychological resistance near the $2,000 threshold be decisively breached to the upside, the primary technical ceiling is identified at $2,380. Reclaiming this structural pivot point would be an essential prerequisite for market bulls to re-establish sustained upward momentum.
- Support Levels: If the long-term structural support at $1,500 is invalidated, the next critical floor rests at the $1,000 mark—a psychological boundary of immense significance. A sustained close below this threshold would likely intensify liquidation pressure and significantly increase the probability of a deeper, prolonged market correction.
- Momentum Indicators: The Moving Average Convergence Divergence (MACD) indicator exhibits a distinct bullish divergence against price action, implying that a near-term price recovery may be materialising. Simultaneously, the Relative Strength Index (RSI) is tracking an upward trajectory out of lower boundaries, suggesting that underlying buying momentum could soon re-emerge. Nevertheless, near-term price discovery will remain heavily dependent on how these fluid macroeconomic and geopolitical developments unfold.
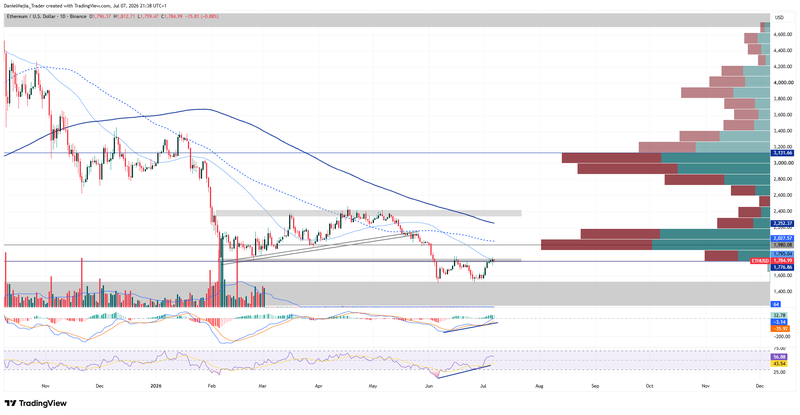
Figure 1. Ethereum Prices (2025–2026). Source: Data from the Binance Exchange; own analysis conducted via TradingView.