Help
Help Geopolitical uncertainty and a restrictive Fed put pressure on Bitcoin
Bitcoin fell by 1.81% to $62,129 as renewed US–Iran tensions and hawkish Federal Reserve expectations weakened risk appetite globally. Markets priced a 51.9% probability of a September rate hike, while 10-year Treasury yields reached 4.58%.

Bitcoin dropped by 1.81% to $62,129 as renewed US–Iran tensions pushed investors away from risk assets.
Fed rate-hike expectations strengthened, with markets pricing a 51.3% probability of a September rate increase.
US 10-year Treasury yields rose to 4.58%, reflecting inflation concerns linked to energy and geopolitical risks.
Bitcoin comes under pressure amid renewed US–Iran tensions and a hawkish Fed
Bitcoin prices came under pressure amid renewed geopolitical tensions between the United States and Iran. According to Reuters reports, US President Donald Trump stated that an interim agreement with Iran aimed at ending the conflict was “over” following overnight attacks involving both sides. In addition, international media reports indicated that the United States could launch further strikes against Iranian targets with the objective of reducing Tehran’s ability to implement military influence in the Strait of Hormuz.
Consequently, expectations that the Federal Reserve could maintain a more hawkish monetary policy stance strengthened. According to the CME FedWatch Tool, the market-implied probability of an interest rate hike at the September meeting remained the highest-probability scenario, standing at 51.3%. Meanwhile, the likelihood of a second rate increase by the December meeting reached 34%, reflecting growing concerns that geopolitical tensions and higher energy prices could generate additional inflationary pressures. These expectations were also reinforced by the minutes of the Federal Reserve's June meeting, which indicated that policymakers remain highly focused on inflation risks and are committed to returning inflation to the 2% target.
This combination of factors weighed on Bitcoin, which closed the session 1.81% lower at $62,129. Periods of heightened geopolitical uncertainty tend to reduce investors’ appetite for risk, prompting capital flows away from speculative assets and towards more defensive or traditional safe-haven investments. At the same time, expectations of higher interest rates can place further pressure on cryptocurrencies, as investors may find more attractive risk-adjusted returns in fixed-income markets.
These dynamics were also reflected in the US bond market, where the yield on the 10-year Treasury note rose to 4.58%, its highest level since 20 May 2026. The increase in sovereign yields suggests that investors are reassessing the outlook for US monetary policy, particularly in light of the potential inflationary impact of higher energy prices and escalating geopolitical risks.
Technical analysis of Bitcoin
From a technical perspective, Bitcoin remains locked in a downward trajectory that reflects persistent distribution and selling pressure. A closer inspection of the current market structure reveals several key technical observations:
- Trend context: On daily timeframes, Bitcoin continues to trade below its 50-day, 100-day, and 200-day Simple Moving Averages (SMAs). This sustained positioning beneath major moving averages reinforces the prevailing long-term bearish bias.
- Resistance levels: Should immediate short-term resistance near $64,000 be reclaimed, the next major technical ceiling is identified at $74,000—a level that converges with the descending 200-day SMA. A decisive close above the $74,000 zone would effectively invalidate the current macro downtrend and signal the potential for a broader structural recovery.
- Support levels: If the primary structural support at $60,000 is compromised, the next critical floor is situated at the $53,000 mark, which has historically served as a prominent long-term structural pivot. A sustained breach below $53,000 would significantly increase the probability of a deeper market correction.
- Momentum indicators: In contrast to the bearish price action, the Moving Average Convergence Divergence (MACD) is currently showing improving momentum, hinting at localised short-term price stabilisation. At the same time, the Relative Strength Index (RSI) is recovering from near-oversold territory, suggesting that immediate selling pressure may be losing underlying momentum. However, economic and geopolitical factors are expected to remain the predominant drivers of future market direction.
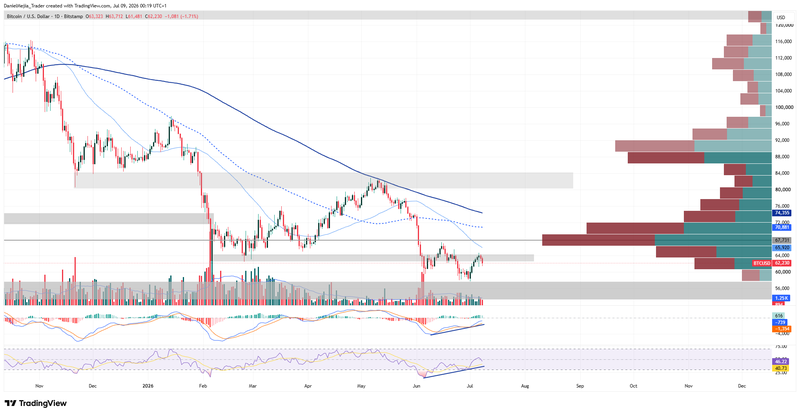
Figure 1. Bitcoin Prices (2025–2026). Source: Own analysis conducted via TradingView.