
 Help
Help Solana advances on weak US NFP data, but market uncertainty persists
Solana edged up following weaker US non-farm payrolls data, which tempered interest rate hike expectations. Despite the modest gain, elevated market uncertainty continues to keep prices oscillating within a broader consolidation range.

US July non-farm payrolls (NFP) contracted by 23,000, reducing the probability of a September Federal Reserve interest rate hike.
A neutral or lower rate outlook generally supports high-risk assets, although Solana remains strictly range-bound.
Solana’s price performance reflects significant market hesitation as it continues to trade within a sideways (lateral) market structure.
Date: 7 August 2026
Solana rises on weak US jobs data, but directional conviction remains limited
Solana’s price rose marginally by 0.27% to $73.83 amid a weak non-farm payrolls (NFP) report that dampened expectations of a Federal Reserve interest rate hike at its upcoming meeting.
According to data released by the US Bureau of Labor Statistics (BLS), non-farm payrolls contracted by 23,000 in July—a downside surprise compared to the anticipated addition of 80,000 jobs. This data release caused market-implied probabilities of an interest rate hike to decline. According to the CME FedWatch Tool, the probability of a 25-basis-point rate increase fell from approximately 54% to 44%, leaving a 56% probability that the Federal Reserve will hold interest rates steady at the current 3.75% level during its September meeting.
An environment of potential neutral or lower interest rates from the US central bank typically supports cryptocurrencies, as high-risk assets become relatively more attractive than fixed-income instruments. However, Solana’s price remains stagnant, oscillating within a consolidation range that has persisted over recent six months. Although Solana has recovered by 18% from its early-June low, it continues to exhibit a sideways trajectory, reflecting a distinct lack of directional conviction.
Technical analysis of Solana
From a technical perspective, Solana has established a distinct bearish trajectory. A detailed examination of the current market structure reveals several key observations:
- Trend Context: On daily timeframes, Solana continues to trade below its 100-day and 200-day Simple Moving Averages (SMAs), reinforcing the prevailing bearish bias. In the short term, price action remains confined within a consolidation range, reflecting high uncertainty and an absence of clear market direction.
- Resistance Levels: Should buyers reclaim immediate resistance near $83—a level that converges with the 200-day SMA—the next major technical barrier is identified at $97. A decisive close above the $97 zone would alter the broader market structure, opening scope for a materially higher valuation.
- Support Levels: If primary support at $69 is invalidated, the next structural floor lies at the psychological $60 level. A sustained break below this threshold would likely accelerate selling pressure and heighten the risk of a deeper market correction.
- Momentum Indicators: Both the Moving Average Convergence Divergence (MACD) and the Relative Strength Index (RSI) are hovering at neutral levels, underscoring the absence of a prevailing trend. Consequently, macroeconomic and geopolitical factors are expected to remain the primary drivers of near-term price movement.
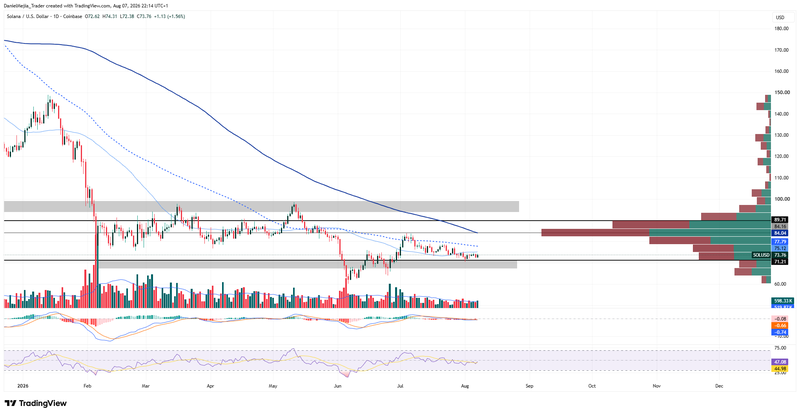
Figure 1. Solana's Price (2025–2026). Source: Data from the Coinbase Exchange; own analysis conducted via TradingView.


