Help
Help Solana climbs with the crypto market as it tests a critical resistance zone
Solana has rallied nearly 30% week-on-week to $98.98, driven by US regulatory optimism. However, escalating geopolitical tensions in the Middle East and persistent inflation risks pose challenges to sustaining this bullish momentum.
Crypto prices surged following proposed US token regulations and renewed pressure on Congress to pass the Clarity Act.
Solana has gained approximately 30% over the past week, approaching a critical $100 psychological resistance threshold.
Escalating conflict in the Middle East and threats to oil supplies have heightened inflation risks that could prompt Federal Reserve tightening, signalling caution across crypto assets.
Date: 24 August 2026
Solana gains momentum on crypto market strength, approaching a key technical level
A crypto rally continues to advance following pressure from US President Donald Trump to secure congressional approval of the Clarity Act, alongside a SEC proposal for a new regulatory framework designed to streamline token issuance and capital raising for crypto firms in the United States. If approved, these measures could instil greater confidence among market participants, particularly institutional investors seeking regulated assets for their portfolio strategies. However, although these regulatory frameworks have yet to receive formal approval, crypto assets have staged a significant market rally in recent days.
For Solana, this translates into a weekly appreciation of approximately 30% amid the ongoing market expansion. At market close, Solana advanced 3.8%, trading at $98.98. This surge comes as the crypto asset tests key technical resistance near the $100 threshold—a critical psychological level. Notably, Solana had been trading inside a consolidation range pattern for around six months; a decisive upside breakout from this structure could signal further price appreciation.
However, the sustainability of the current crypto rally faces notable headwinds. Chief among these are persistent inflationary pressures stemming from the escalating conflict between the US and Iran in the Middle East. According to Reuters reports, the United States announced expanded economic sanctions aimed at severely impacting the Iranian economy. Prior to the US announcement, Iran outlined two potential countermeasures: a direct military response and a further reduction in Gulf oil exports—a move that could exacerbate existing energy supply disruptions in the region. Should inflationary pressures persist, the Federal Reserve may be forced to adopt a tighter monetary stance to contain prices, which could adversely affect cryptocurrencies.
Thus, Solana continues to climb on heightened risk appetite as market participants seek to capitalise on the rally, although mounting economic and geopolitical risks suggest caution regarding the durability of this bullish momentum.
Technical analysis of Solana
From a technical perspective, although Solana previously established a distinct bearish trajectory, it is currently signalling a meaningful price recovery. A detailed examination of the current market structure reveals the following key observations:
- Trend Context: On daily timeframes, Solana has reclaimed its 50-day, 100-day, and 200-day Simple Moving Averages (SMAs), trading comfortably above these technical metrics. In the short term, Solana's price is attempting an upside breakout from a consolidation pattern, signalling potential further appreciation if the resistance is breached.
- Resistance Levels: Should the price breach the $100 threshold—a level that coincides with the ceiling of the consolidation pattern—the next major technical barrier lies at $142. A decisive close above these zones would increase the probability of expansion towards higher market capitalisation.
- Support Levels: If the $100 resistance holds and the price is rejected to the downside, the primary structural floor lies at the $83 level, which converges with the 200-day SMA. A sustained breakdown below this threshold would likely accelerate selling pressure and heighten the risk of a deeper market correction, potentially testing the $69 zone.
- Momentum Indicators: The Moving Average Convergence Divergence (MACD) indicates expanding upward momentum, suggesting that the current rally could continue. Conversely, the Relative Strength Index (RSI) is trading in overbought territory, signalling caution for the immediate bullish impulse.
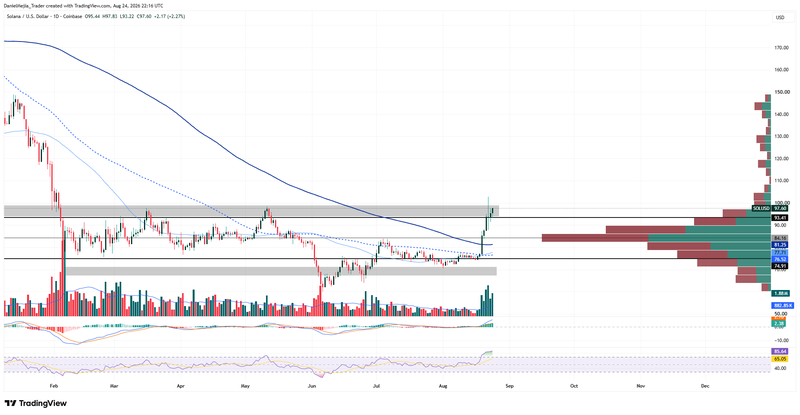
Figure 1. Solana prices (2025–2026). Source: Data from Coinbase Exchange; author's analysis conducted via TradingView.