
 Help
Help Solana drops following inflation surprise and rising hawkish Fed expectations
Solana fell by 2.51% to $104.10 as higher US inflation reinforced expectations of a hawkish Federal Reserve interest rate hike.

US inflation rose to 3.7% in September, driving market expectations of further Federal Reserve interest rate hikes.
The CME FedWatch Tool reflects an increased probability of an interest rate hike at the Federal Reserve's December meeting.
Higher US Treasury yields tend to weaken cryptocurrency market sentiment as investors look for superior risk-adjusted returns on the bond market.
Date: 15 October 2026
Is Solana losing momentum as inflation data strengthens hawkish Fed expectations?
Solana dropped by 2.51% to $104.10 at market close following a higher-than-expected US inflation reading, which heightened expectations that the Federal Reserve will adopt a more restrictive monetary policy stance.
According to data released by the US Bureau of Labor Statistics (BLS), headline inflation accelerated from 3.4% in August to 3.7% in September, exceeding analysts' estimates of 3.6%. Furthermore, the BLS report revealed that core inflation—which excludes volatile components such as energy and unprocessed food—accelerated slightly from 2.4% to 2.6%. Underlying price pressures on headline inflation were primarily driven by rising costs for gasoline and fuel oil, including diesel and jet fuel.
Consequently, the CME FedWatch Tool indicated a 62% probability of a 25-basis-point interest rate hike and a 29% likelihood of a 50-basis-point increase by the Federal Reserve's December meeting. Meanwhile, market expectations for the October meeting favoured an unchanged stance, with an implied probability of 72%.
Cryptocurrencies have experienced negative market sentiment amid expectations of monetary policy tightening by the Federal Reserve. This reaction stems from rising interest rates enhancing US Treasury yields, thereby attracting global investors seeking higher risk-adjusted returns for their portfolios.
Technical analysis of Solana
From a technical perspective, Solana's price has shown signs of bullish momentum following a multi-month period of consolidation. A detailed examination of the current market structure reveals the following key dynamics:
- Trend Context: On daily timeframes, Solana continues to trade comfortably above its 100-day and 200-day Simple Moving Averages (SMAs), suggesting that broader bullish momentum remains intact. However, significant selling pressure over the past weeks suggests caution regarding the sustainability of this short-term upward trend.
- Momentum Indicators: The Moving Average Convergence Divergence (MACD) indicator is trending downwards and crossing below the zero line, indicating that short-term bearish momentum could persist. Additionally, the Relative Strength Index (RSI) is declining, further pointing to short-term weakness, although it is approaching oversold territory.
- Bullish Scenario: Should bullish momentum re-emerge, the immediate resistance level sits at $124, which converges with the Volume Profile’s Value Area High (VAH). Beyond this zone, $145 represents a prominent technical ceiling. A decisive close above these levels would increase the probability of a further expansion towards higher market capitalisation zones.
- Bearish Scenario: If selling pressure persists, key support levels are located at $96.50 (a structural support zone) and $88.00 (where the 200-day SMA coincides with the Volume Profile’s Point of Control). A sustained breakdown below these levels would heighten the likelihood of a deeper market correction.
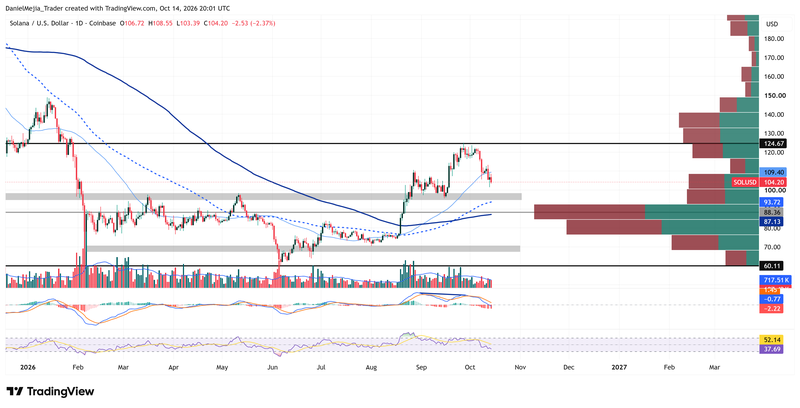
Figure 1. Solana Price Chart (2025–2026). Source: Data from Coinbase Exchange; author's analysis conducted via TradingView.


