Help
Help 
Gold after the correction: Recovery or further downside?
Gold enters the third quarter at an important turning point. After reaching record highs earlier this year, the precious metal has undergone one of its sharpest corrections in recent history as shifting interest-rate expectations reshaped investor sentiment. While central-bank demand continues to provide long-term support, markets will be watching closely to see whether easing monetary policy expectations and technical price action can sustain the recent recovery.

Gold decline of more than $1,500 from peak to trough in just five months.
The real driver was the repricing of the expected monetary policy path.
World Gold Council's 2026 survey also found that 89% of central-bank reserve managers expect global gold reserves to increase over the next 12 months.
From record highs to a sharp correction
Gold entered 2026 with exceptional momentum. The metal had risen by roughly 45% over the previous 12 months, driven by a powerful mix of elevated structural demand from central banks, the repositioning of major global financial institutions in the Western Hemisphere away from dollar-denominated assets, and a geopolitical risk premium that surged after the United States and Israel launched military operations against Iran in late February.
On 28 January 2026, XAU/USD touched an intraday record of $5,589 an ounce, a level that, in hindsight, appears to have marked the peak of market sentiment rather than the start of a sustained breakout.
What followed was one of the sharpest corrections gold has seen in modern history. By late June, the metal had fallen below $4,000, a decline of more than $1,500 from peak to trough in just five months.
How changing rate expectations drove the sell-off
The reversal was not caused by a collapse in structural demand. Central banks, which the World Gold Council estimates bought 244 tonnes in the first quarter of 2026 alone, continued to accumulate gold throughout the sell-off.
The real driver was the repricing of the expected monetary policy path. The same conflict that initially lifted gold and oil triggered an inflation shock that forced markets to reassess the Federal Reserve's policy trajectory under its new chair, Kevin Warsh.
Higher energy prices caused by disruption around the Strait of Hormuz fed directly into the US Consumer Price Index, complicating the Fed's data-dependent framework. While markets had been pricing in 50 basis points of rate cuts for the year, futures shifted towards a 25-basis-point rate increase. That represented a 75-basis-point swing in policy expectations, unsettling a non-yielding asset. Real yields rose sharply, the dollar strengthened and ETF holders who had built large positions during gold's 2025 rally began reducing exposure as the opportunity cost of holding the precious metal increased.
XAU/USD’s path in 2026: the retreat from record highs.
Can gold's recovery continue?
The turning point came on 2 July, when the US jobs report for June showed that the economy added only 57,000 jobs, roughly half the 110,000 expected, while the previous two months were revised lower by a combined 74,000. The weaker-than-expected data reduced the case for further monetary tightening.
The probability of a September rate hike, according to the CME FedWatch Tool, fell from 66% to around 50% within hours. Gold responded immediately, rising more than 2% during the 3 July session, its strongest daily performance since mid-June, before extending its recovery to around $4,148 by 7 July.
The key question for the third quarter is whether this rebound marks a genuine trend reversal or merely a countertrend move within a broader corrective structure.
From a technical perspective, caution is still warranted. XAU/USD is currently trading below both its 50-day moving average at $4,402 and its 200-day moving average at $4,486, a configuration that remains technically bearish regardless of momentum in any single session. The 20-day moving average, near $4,156, acted as resistance throughout June's decline and is now the first short-term support level. A weekly close above the 50-day moving average would provide the first credible sign that selling pressure is easing. Until then, the broader structure remains an unproven rebound.
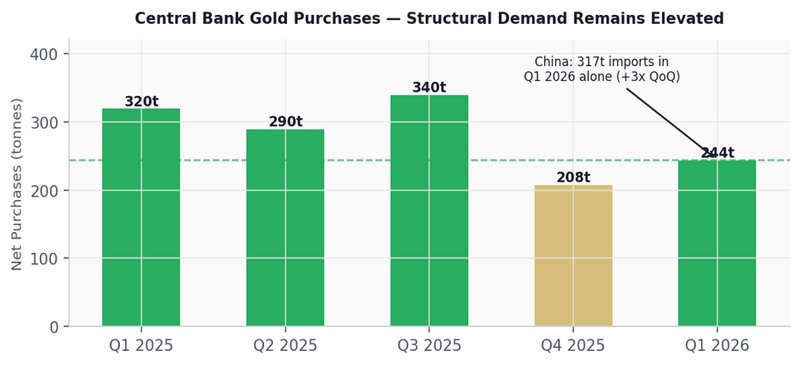
Central-bank gold purchases, in tonnes.
Central banks and market expectations remain key drivers of gold
Beyond technical factors, central-bank behaviour remains one of the strongest structural drivers of gold prices. Reported net purchases totalled 244 tonnes in the first quarter of 2026, while flows through the over-the-counter market and unreported purchases are estimated to have been significantly higher. The World Gold Council's 2026 survey also found that 89% of central-bank reserve managers expect global gold reserves to increase over the next 12 months, a record figure. China also continued reducing its reliance on dollar assets for strategic reasons, importing 317 tonnes in the first quarter of 2026, nearly three times the level recorded in the fourth quarter of 2025. The freezing of Russia's central-bank assets in 2022 also reshaped how many emerging-market central banks approach reserve management.
Institutional forecasts for the third quarter remain broadly constructive, despite considerable uncertainty. Price targets range from $4,300, the base-case forecast from Deutsche Bank and ING, to $6,300 in JPMorgan's bullish scenario, with Goldman Sachs targeting $5,400 by year-end and Morgan Stanley forecasting $5,200. TD Securities believes a move below $3,900 is unlikely unless an early rate hike becomes a realistic possibility, identifying $4,280 as the nearest likely resistance level. Overall, the wide range of forecasts reflects uncertainty over the path of Federal Reserve policy rather than disagreement over gold's long-term structural outlook.
For traders, the third-quarter framework remains finely balanced. Downside risk continues to be supported by central-bank buying, which has historically provided a floor around the $3,900-$4,000 area, while renewed geopolitical tensions involving Iran or the Strait of Hormuz could quickly revive safe-haven demand. The upside case, however, still requires confirmation. Either the Federal Reserve needs to signal a clear pause, allowing real yields to fall and ETF investors to return, or a fresh geopolitical shock needs to reignite the risk premium. In the absence of either catalyst, the World Gold Council's expectation of a volatile, range-bound market remains the most likely scenario.