
 Help
Help Alphabet shares: A fundamental and technical overview
Despite exceeding revenue and earnings per share (EPS) estimates with strong artificial growth, Alphabet shares have fallen by 4.5% amidst heightened market scrutiny of the tech sector. Long-term technical trend remains bullish, though short-term downward price pressure persists.

Alphabet's Q2 revenue ($119.8bn) and EPS ($9.11) comfortably beat market expectations, yet the stock have retreated by 4.5%.
Net margins surged to 93.7%, bolstered by unusual non-operating income, whilst increased debt leverage continues to fund capital expansion.
The company continues to exhibit robust revenue growth and balance-sheet expansion, underpinned by solid operating margins.
Date: 27 July 2026
Alphabet shares fall despite beating analyst revenue and EPS expectations
Alphabet Inc.’s shares have retreated by 4.5%, despite the firm exceeding analyst consensus on both total revenue and earnings per share (EPS) in Q2 2026. The technology giant generated $119.8 billion in total revenue, comfortably above the forecast of $116.51 billion. Concurrently, Alphabet achieved earnings per share of $9.11, significantly outperforming the market consensus estimate of $2.88. These figures represent a year-on-year (YoY) revenue growth rate of 24% and a substantial YoY surge of 294% in EPS.
Although the net income figure represents an outlier driven by unusual non-operating income, the underlying operating income trajectory continues at a robust pace. Nevertheless, Alphabet’s shares face selling pressure as market participants exercise heightened scrutiny over artificial intelligence-related capital expenditure and monetization timelines.
Financial overview of Alphabet Inc.
Alphabet’s revenue trajectory demonstrates strong growth momentum over recent quarters, accelerating from a 3% YoY increase in Q1 2023 to 24% in Q2 2026. The company's average annual revenue growth rate stands at 17.7% over the past six years.
Furthermore, net income expanded significantly, yielding a net margin of 93.7% in Q2 2026—though this was augmented by exceptional, non-recurring income items. While the six-year average net margin stands at 29%, margins have consistently tracked above this benchmark since Q1 2025, indicating sustained cost efficiency and revenue strength.
In addition, although the debt ratio (total debt to total assets) increased to 12.7% in the latest quarter, Figure 1 illustrates how Alphabet is leveraging debt to drive rapid balance-sheet expansion. Total assets surged by 84% YoY in Q2 2026, reflecting the group’s commitment to capital-intensive growth projects—most notably in artificial intelligence, where its products have secured significant market share and user adoption.
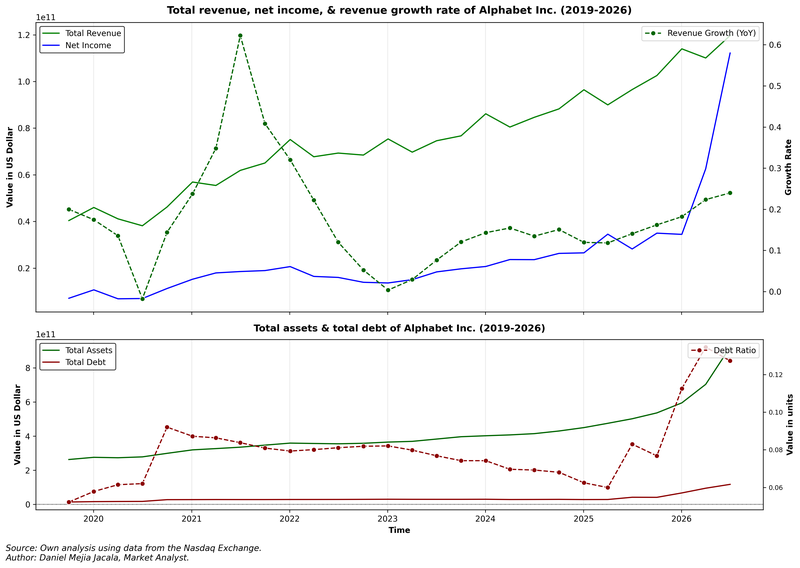
Figure 1. Alphabet’s Revenue, Net Income, Total Debt, & Total Assets (2019–2026). Source: Own analysis using data from the Nasdaq Exchange.
Technical analysis of Alphabet’s shares
From a technical perspective, Alphabet’s share price maintains its primary long-term bullish trajectory. Key technical observations include:
- Trend Context: Over the long term, Alphabet retains a market structure defined by a series of higher highs and higher lows. The stock trades comfortably above its 200-day simple moving average (SMA), reinforcing the underlying bullish momentum. However, the short-term structure exhibits mounting selling pressure, contrasting with its sound fundamental backing.
- Resistance Levels: Provided the price holds above the 200-day SMA and rebounds upward, immediate overhead resistance lies at $370. A second structural ceiling is positioned at the all-time high of $402.50. A decisive close above this barrier would likely trigger a new expansionary phase toward higher valuation zones.
- Support Levels: Should the immediate support at $324 (corresponding to the 200-day SMA) fail to hold, the next critical floor is identified at $275. This level aligns with key short-term structural support within the price action. A breakdown below $275 would substantially increase the likelihood of a more pronounced market correction.
- Momentum and Volume: The Moving Average Convergence Divergence (MACD) indicator continues to exhibit a downward trajectory, suggesting that short-term bearish pressure may persist. Conversely, the Relative Strength Index (RSI) is approaching oversold territory. Nevertheless, fundamental catalysts are expected to play a decisive role in determining the stock's future directional bias.
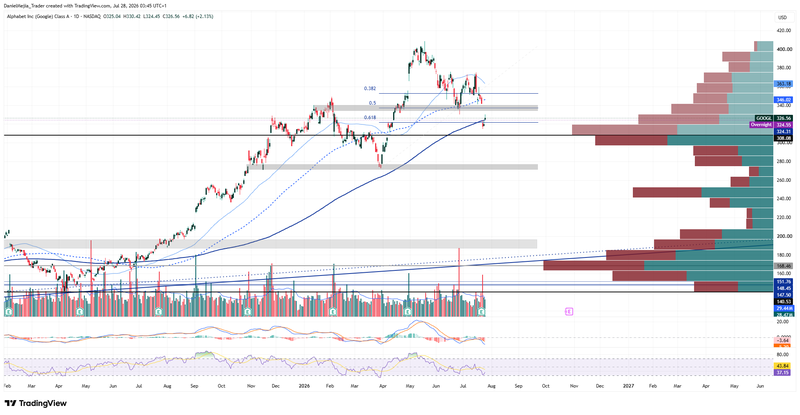
Figure 2. Alphabet’s Shares (2025–2026). Source: Data from the Nasdaq Exchange; Own analysis conducted via TradingView.


