
 Help
Help Amazon shares: A fundamental and technical overview
Amazon delivered strong Q2 2026 earnings, beating expectations with $200.6 billion revenue and $5.75 EPS. While fundamentals and long-term technicals remain bullish, overbought momentum indicators signal potential short-term price consolidation.

Amazon Q2 2026 net revenue reached $200.6 billion (a 19.6% year-on-year growth rate), comfortably beating analyst expectations.
Diluted EPS rose to $5.75, driving a 15% appreciation in share price underpinned by robust core operational fundamentals.
Total assets expanded to $1.096 trillion, while the debt-to-assets ratio declined to 22%.
Shares continue to trade above key Simple Moving Averages (SMAs); however, overbought RSI and MACD readings point to a potential consolidation or pullback phase.
Date: 11 August 2026
Amazon releases a solid report for Q2 2026
Amazon Inc. released a strong Q2 2026 financial report, exceeding market forecasts across both top-line revenue and net earnings per share (EPS). The e-commerce and cloud logistics enterprise generated $200.6 billion in quarterly revenue, outperforming the consensus estimate of $196.16 billion. Furthermore, the firm reported an EPS figure of $5.75, substantially beating the $1.81 market projection. These figures represent a year-on-year (YoY) revenue increase of 19.6% alongside a 242% YoY surge in reported EPS. Following the publication of these results, Amazon's equity valuation has appreciated by approximately 15%, reflecting strong investor confidence in its fundamental trajectory.
Financial overview of Amazon Inc.
Amazon’s revenue performance demonstrates a stable upward trajectory over the past six years, characterised by an average annual revenue growth rate of 17.9%. Notably, top-line growth has accelerated consistently since Q1 2025. Concurrently, net income has exhibited sustained quarterly expansion, marked by a prominent 245% YoY increase in Q2 2026.
Simultaneously, asset accumulation has expanded steadily across reporting periods, underscoring Amazon’s continued commitment to its long- and short-term capital deployment strategies. In Q2 2026, total asset valuation reached the $1.096 trillion milestone. Crucially, this growth in total asset capacity has been matched by a declining debt-to-assets ratio, which has contracted to 22%. This deleveraging trend indicates prudent balance sheet risk management even as capital investment remains on an ascending path.
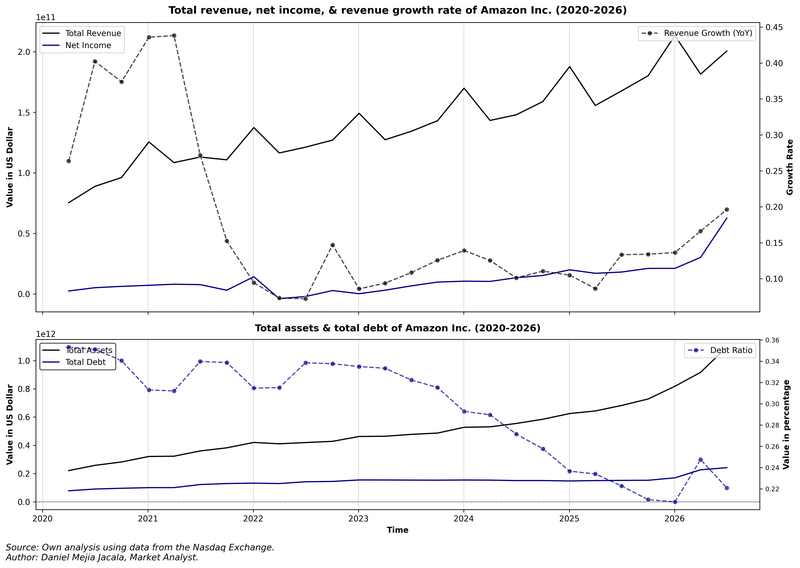
Figure 1. Amazon’s Revenue, Net Income, Total Debt, & Total Assets (2020–2026). Source: Own analysis using data from the Nasdaq Exchange.
Technical analysis of Amazon’s shares
From a technical perspective, Amazon’s share price maintains a well-established, long-term bullish trend. Primary structural observations include:
- Trend Context: On long-term timeframes, Amazon preserves a market structure defined by a consistent sequence of "higher highs" and "higher lows". The price continues to trade comfortably above its 50-, 100-, and 200-day Simple Moving Averages (SMAs), confirming underlying trend strength as price action fluctuates near historic highs.
- Resistance Levels: Should buying volume push price action above immediate resistance at $284 (the current all-time peak), the next critical level sits at the $300 psychological ceiling. A decisive breakout and close above $300 would likely initiate a new expansionary phase into uncharted price discovery zones.
- Support Levels: If immediate support at $265 fails to hold, the primary structural floor is identified at $237, where the 200-day SMA converges. A failure to defend the $237 level would significantly increase the probability of a deeper market correction.
- Momentum and Volume: Both the Moving Average Convergence Divergence (MACD) and the Relative Strength Index (RSI) are currently situated in overbought territory, pointing to potential momentum exhaustion. Notably, the MACD is exhibiting a bearish divergence, reinforcing the thesis of a potential price retracement or consolidation phase.
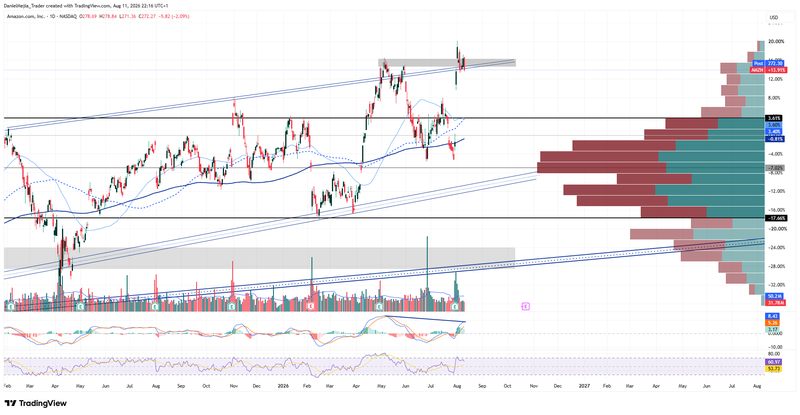
Figure 2. Amazon’s Share (2025–2026). Source: Data from the Nasdaq Exchange; Own analysis conducted via TradingView.


