
 Help
Help Berkshire Hathaway shares: A fundamental and technical overview
Berkshire Hathaway approaches its Q2 2026 earnings release supported by rising market confidence. Solid revenue growth, strong asset performance, lower debt risk, and bullish technical indicators reinforce ongoing upward momentum, despite short-term indicators signalling overbought conditions.

Analysts project $96.52 billion in revenue (+4.3% YoY), though EPS may decline by 2.5% to $5.04.
Prudent risk management is highlighted by a low debt-to-assets ratio of 11.7%.
Shares closed up 1.11% at $524.61, sustaining a primary long-term bullish market structure.
Date: 6 August 2026
Berkshire Hathaway shares advance ahead of Q2 earnings results
Berkshire Hathaway is set to release its Q2 2026 earnings results. As the tenth-largest constituent of the S&P 500 index, boasting a market capitalisation of $1.02 trillion, these figures carry significant weight for the broader market. Consensus forecasts amongst market analysts anticipate total revenue of $96.52 billion, representing a year-on-year (YoY) growth rate of 4.3%. Meanwhile, market expectations project earnings per share (EPS) of $5.04, reflecting a potential YoY contraction of 2.5%.
At market close, Berkshire Hathaway’s shares rose by 1.11% to $524.61, underscoring investor confidence in the financial conglomerate’s potential to deliver solid operational results.
Financial overview of Berkshire Hathaway Inc.
Berkshire Hathaway’s revenue trajectory demonstrates a steady, albeit moderated, growth performance over the past years. Total revenue remains on an upward trend, with an average growth rate of 6.4%. Conversely, net income exhibits a horizontal trajectory, yielding an average negative growth rate of 23% due to sharp historical fluctuations. Nevertheless, despite this volatility, the company maintains an average net margin of 19.3%, underscoring robust operational profitability.
Concurrently, total assets have maintained an ascending trajectory over recent years, while the debt-to-assets ratio has steadily declined, reaching 11.7% in Q1 2026. This balance sheet structure highlights Berkshire Hathaway’s disciplined risk management, enabling sustained asset growth while maintaining strict control over solvency and debt risks.
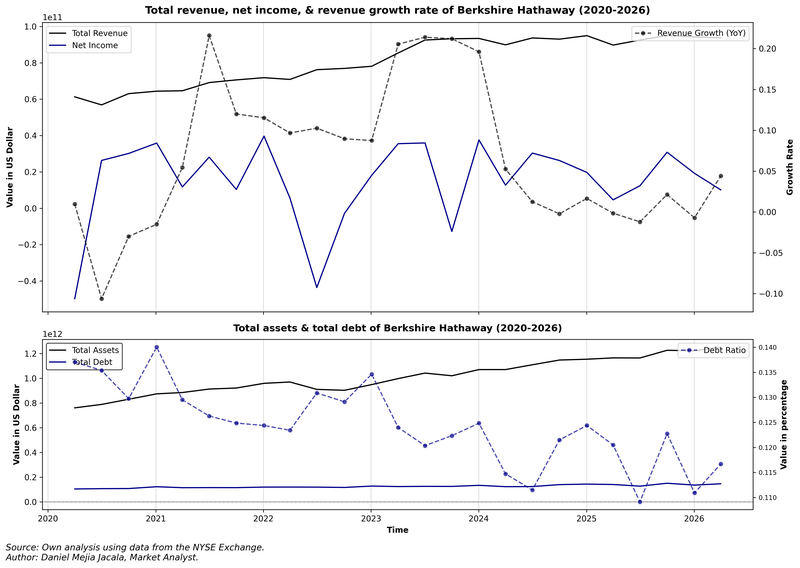
Figure 1. Berkshire Hathaway’s Revenue, Net Income, Total Debt, & Total Assets (2020–2026). Source: Own analysis using data from the NYSE Exchange.
Technical analysis of Berkshire Hathaway’s shares
From a technical perspective, Berkshire Hathaway’s share price maintains its primary long-term bullish trajectory. Key observations include:
- Trend Context: Over the long term, Berkshire Hathaway retains a market structure defined by a series of higher highs and higher lows. The stock trades comfortably above its 50-day, 100-day, and 200-day simple moving averages (SMAs), reinforcing the underlying bullish momentum.
- Resistance Levels: Should the price maintain its upward momentum, the primary resistance level is identified at $539—its record high. A decisive close above this ceiling would likely trigger a new expansionary phase toward higher valuation zones, with the $550 level acting as a key psychological barrier.
- Support Levels: In the event of a market retracement, the immediate support zone rests at $515, followed by a secondary technical floor at $508. A breakdown below these levels would substantially increase the likelihood of a more pronounced correction.
- Momentum and Volume: The Moving Average Convergence Divergence (MACD) indicator continues on an ascending trajectory, suggesting that short-term momentum remains intact. Conversely, the Relative Strength Index (RSI) is approaching overbought territory, indicating the possibility of a short-term consolidation phase or pullback. Ultimately, fundamental catalysts will play a decisive role in determining the stock's future directional bias.
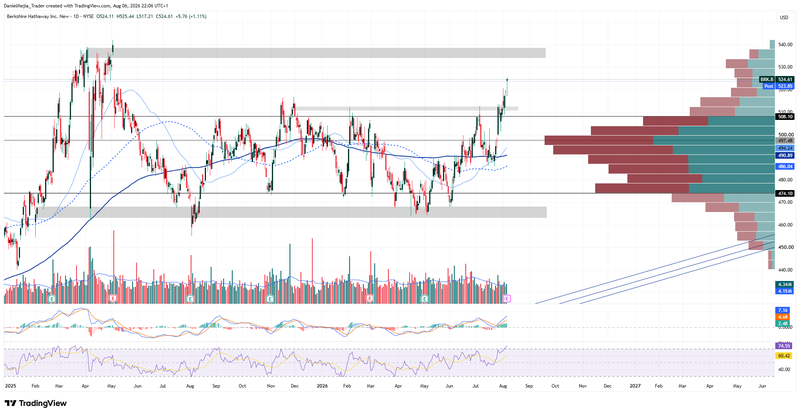
Figure 2. Berkshire Hathaway’s Shares (2025–2026). Source: Data from the NYSE Exchange; Own analysis conducted via TradingView.


