
 Help
Help Boeing beats revenue forecasts but misses EPS estimates; Shares advance
Boeing shares surged 4.76% after second-quarter revenue surpassed market expectations, reaching $24.60 billion. However, earnings per share (EPS) missed estimates with a contraction of $0.76, as the stock continues to trade within a consolidation range.

Boeing's Q2 revenue reached $24.60 billion, beating the $23.95 billion consensus forecast and delivering a 7.9% year-on-year increase.
Boeing's EPS contracted by $0.76, missing the estimated $0.29 loss, though representing an improvement over the previous year's loss.
Boeing’s debt-to-assets ratio has declined from 42% to 28%, mitigating leverage risks despite ongoing net losses.
Date: 28 July 2026
Boeing exceeds revenue expectations but falls short on earnings; Stock moves higher
The Boeing Company concluded the trading session with a solid gain after releasing its financial results for the second quarter.
The Aerospace & Defence giant surpassed market expectations on revenue but missed EPS estimates. The firm generated $24.60 billion in revenue, beating the forecast of $23.95 billion. Conversely, Boeing reported an EPS contraction of $0.76, representing a deeper loss than the $0.29 contraction anticipated by analysts. These results reflect a year-on-year (YoY) revenue growth rate of 7.9% and an improvement over the previous year's quarter, when EPS contracted by $1.24. Consequently, Boeing’s shares advanced by 4.76% to close at $221.56.
Financial overview of The Boeing Company
Boeing’s revenue trajectory demonstrates persistent growth, despite occasional periods of negative sales performance. Over the past six years, the approximate compound revenue growth rate stands at 3.2%. However, bottom-line profitability remains the most challenging factor, with net losses recorded across various quarters, culminating in an average net margin of –8%.
Meanwhile, a historical analysis reveals that total assets have experienced constrained growth since 2020. Nevertheless, the debt ratio (total debt to total assets) has declined from 42% to 28% in recent periods, indicating a reduction in leverage risk over recent quarters.
In summary, Boeing continues to face headwinds regarding top-line and asset growth, alongside persistent net losses across the analysed period.
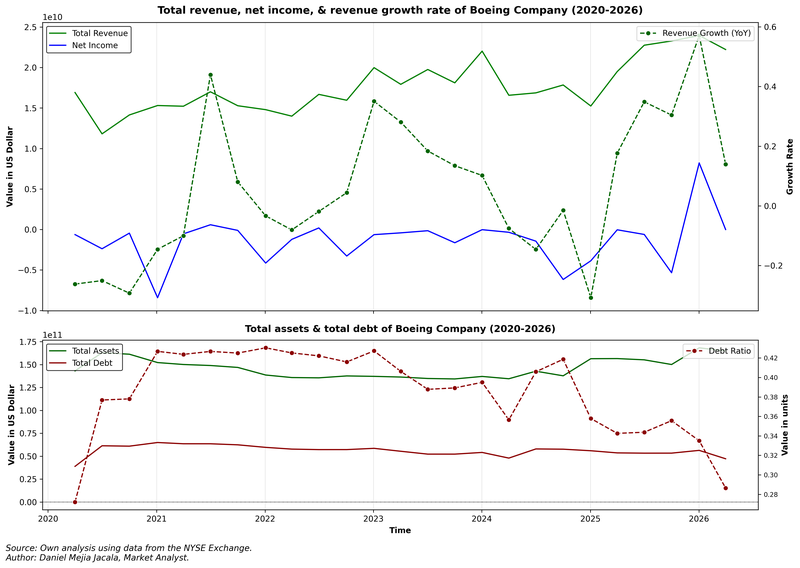
Figure 1. Boeing’s Revenue, Net Income, Total Debt, & Total Assets (2020–2026). Source: Own analysis using data from the NYSE Exchange.
Technical analysis of Boeing’s shares
From a technical perspective, Boeing’s share price remains bound within a consolidation range. Key technical observations include:
- Trend Context: Over the long term, Boeing trades within a range-bound pattern that reflects market indecision. The price has been oscillating inside a symmetrical triangle formation over the past six months.
- Resistance Levels: Should the price breach structural resistance near $233, the next significant technical ceiling is identified at $260. A decisive close above this barrier would likely signal an expansionary phase toward higher valuation levels.
- Support Levels: Should immediate support at $205 fail to hold, the next critical floor is situated at $190, aligning with a key structural pivot zone. A breakdown below $190 would substantially increase the likelihood of a deeper correction.
- Momentum and Volume: Both the Moving Average Convergence Divergence (MACD) and the Relative Strength Index (RSI) are hovering in neutral territory, corroborating the range-bound structure and the absence of a dominant market trend.
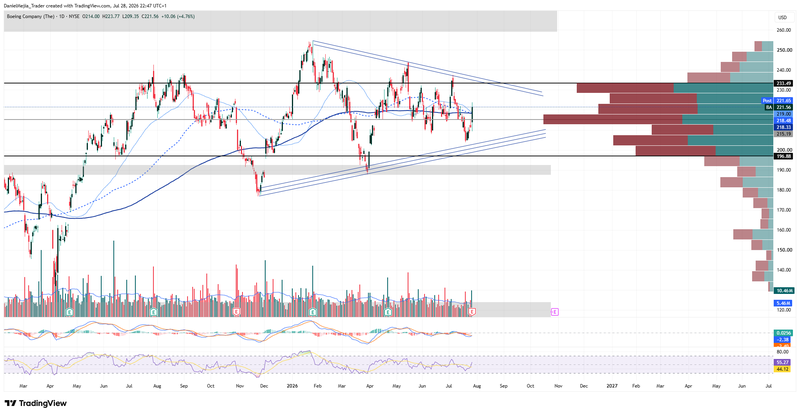
Figure 2. Boeing’s Shares (2025–2026). Source: Data from the NYSE Exchange; Own analysis conducted via TradingView.


