
 Help
Help Dell ahead of Q2 2026 earnings: a fundamental and technical analysis
Dell is set to report its Q2 2026 earnings on 1 September. Driven by strong AI server demand, analysts anticipate substantial year-on-year revenue and EPS growth, although momentum indicators point to near-term price consolidation.

Analysts project Q2 revenue of $44.84bn (up 50.5% YoY) and EPS of $4.87 (up 109% YoY) for Dell Technologies.
Unprecedented demand for AI servers continues to drive revenue and improve debt management.
Technical indicators display a long-term bullish trend currently consolidating within a neutral range.
Date: 26 August 2026
Analysts expect solid growth in revenue and EPS for Dell's quarterly report
Dell Technologies is set to release its Q2 2026 financial report on 1 September. Analysts expect robust growth in both total revenue and earnings per share (EPS). The market consensus anticipates revenue of $44.84 billion and an EPS of $4.87. These expectations imply a year-on-year (YoY) revenue growth rate of 50.5% and a YoY surge of 109% in EPS.
In Q1 2026, the company reported growth across all operating segments. Notably, unprecedented demand for Dell’s artificial intelligence (AI) servers was recorded. Consequently, the YoY revenue growth rate accelerated from 10.7% in Q3 2025 to 87% in Q1 2026, exhibiting a strong growth trajectory (see Figure 1).
Financial overview of Dell Technologies
Dell’s revenue performance has demonstrated a significant improvement since Q1 2025, following a period of subdued growth near 1%. In turn, net income performance reveals a marked expansion since Q2 2025—particularly during the first quarter of 2026, which recorded net income growth of 256%. Nevertheless, the historical average growth rate of net income remains close to 11%. In this context, the average net margin signals moderation around the 4% level.
Meanwhile, Dell’s total assets reflect a notable recovery since Q3 2025, breaking a downward trend in the historical average. This illustrates how revenue generated by AI products is providing substantial support to the broader financial structure. Furthermore, regarding leverage risk, the debt-to-asset ratio has declined from 48% to 27%, revealing a significant improvement in debt management.
While Dell has incurred higher costs for investment purposes, the company remains focused on shareholder returns. In the first quarter of 2026, the company returned approximately $2.1 billion to shareholders: comprising $1.6 billion in share repurchases and $464 million in dividends. This represented roughly 51% of total operating cash flow for the period.
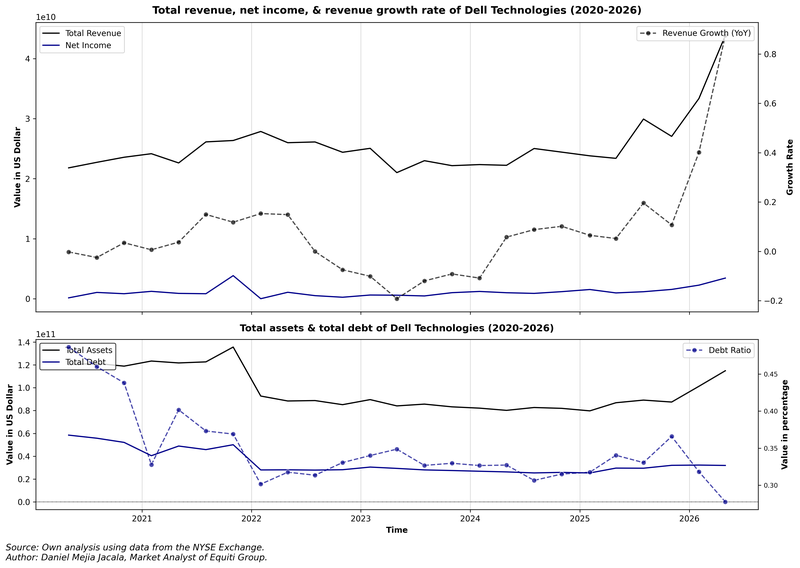
Figure 1. Dell’s Revenue, Net Income, Total Debt, & Total Assets (2020–2026). Source: Author's analysis based on data from the NYSE Exchange.
Additionally, Dell’s valuation ratios reflect some degree of overvaluation, although they remain close to the firm’s industry. The price-to-earnings (P/E) ratio stands at 35.88, while the price-to-sales (P/S) ratio is 2.21. In this context, Investing.com indicates that these multiples remain broadly aligned with industry peers, reflecting a relatively stable performance.
Technical analysis of Dell's shares
From a technical perspective, Dell’s share price maintains an underlying long-term bullish trend. Primary structural observations include:
- Trend Context: On longer timeframes, Dell preserves a market structure defined by a consistent sequence of higher highs and higher lows. The price continues to trade comfortably above its 50-, 100-, and 200-day Simple Moving Averages (SMAs), confirming persistent upward momentum. However, over the last three months, the share price has traded within a consolidation range, signalling temporary market indecision.
- Resistance Levels: Should the resistance level at $469 be breached to the upside, the next critical barrier sits at $494—the all-time high. A decisive breakout and close above these market zones would open the probability towards higher valuation levels, notably the $550 threshold.
- Support Levels: If immediate support at $427 fails to hold, the primary structural floor is identified at $363, where the 100-day SMA converges. A failure to defend this underlying support would significantly increase the probability of a deeper market correction.
- Momentum and Volume: Both the Moving Average Convergence Divergence (MACD) and the Relative Strength Index (RSI) are currently situated at neutral levels, suggesting a lack of a predominant directional bias. Dell’s upcoming earnings report is expected to establish the next main trend direction.
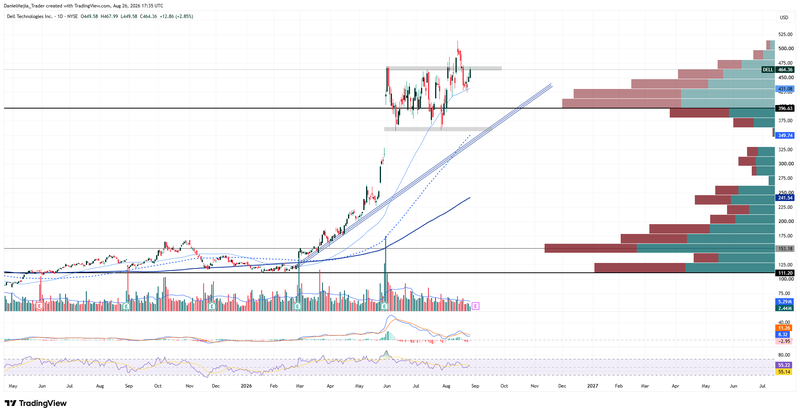
Figure 2. Dell’s Share Price (2025–2026). Source: Data from the NYSE Exchange; Author's analysis conducted via TradingView.


