
 Help
Help JPMorgan shares edge lower after Q3 earnings miss analysts’ expectations
JPMorgan shares dipped slightly after Q3 earnings missed revenue and EPS estimates, despite solid year-on-year growth.
JPMorgan’s Q3 revenue ($50.17bn) and EPS ($5.75) missed expectations, triggering a mild 0.86% share price dip.
Annual revenue (+8%) and EPS (+9.8%) grew, supported by stable margins and strong overall financials.
Total assets exhibit a robust upward trajectory, although the debt-to-assets ratio demonstrates a rising trend.
Date: 14 October 2026
Why are JPMorgan shares falling after its Q3 earnings report?
JPMorgan Chase (JPM) failed to surpass analysts' estimates for both total revenue and earnings per share (EPS) in its Q3 earnings report. The financial giant reported quarterly revenue of $50.17 billion, falling short of the forecast $51.23 billion. Meanwhile, the firm posted an EPS of $5.75, missing the market consensus estimate of $5.93. Nevertheless, despite the downside surprise, the company achieved year-on-year (YoY) revenue growth of 8%, alongside a 9.8% YoY increase in EPS.
Consequently, following the publication of the earnings report, JPMorgan shares declined marginally by 0.86%, despite opening the market session with a +1.71% gap higher.
Financial overview of JPMorgan Chase
JPMorgan’s financials have demonstrated strong performance over recent quarters, with both total revenue and net income exhibiting upward trends. Whilst the YoY average revenue growth rate remains near 13.6%, the most recent quarter revealed a slight deceleration. Concurrently, average annual net income growth remains close to 25% with a Q3 deceleration, while the average net margin has held stable at around 24% over the evaluated period.
Furthermore, total assets display a robust upward trend, accompanied by rising debt levels. Against this backdrop, the debt-to-assets ratio has climbed over recent quarters, reaching 24%. Major banks typically maintain elevated leverage ratios (in terms of debt or liabilities) as they rely heavily on external funding sources. Data from Investing.com indicates that JPMorgan’s current long-term debt-to-capital ratio remains below the industry average. Consequently, the most notable aspect of the debt-to-assets ratio is its rising underlying trend.
Meanwhile, the price-to-earnings (P/E) ratio stands at 14.32x, while the price-to-book (P/B) ratio remains at 2.73x. In both instances, these current valuation metrics align closely with industry peer performance, as highlighted by Investing.com.
Technical analysis of JPMorgan’s share price
Regarding the technical outlook, JPMorgan’s share price maintains its primary bullish trend. Key observations include:
- Trend Context: Over the long term, JPMorgan Chase retains a market structure characterised by higher highs and higher lows within a bullish channel pattern. The share price is currently trading above the 200-day moving average, reinforcing the prevailing upward momentum. However, in the short term, the price is experiencing selling pressure, pushing it below its 50-day and 100-day Simple Moving Averages (SMAs).
- Bullish Scenario: Should the structural support at $330 hold and prompt a rebound to the upside, the next key resistance level sits at $343. If this technical ceiling is breached, the next significant resistance is $365—the all-time high. Overcoming these technical barriers would suggest that long-term bullish momentum is likely to resume.
- Bearish Scenario: If the structural support at $330 is broken to the downside, the primary technical floor is the $322 zone—where the 200-day SMA converges with the long-term trendline support. Should these support zones fail to hold, the likelihood of a deeper market correction would increase.
- Momentum Indicators: The Moving Average Convergence Divergence (MACD) is signalling a bullish crossover, indicating a potential short-term upward impulse. Additionally, the Relative Strength Index (RSI) is nearing oversold territory, supporting the hypothesis of a short-term upward reversal. Nevertheless, US equity markets could face heightened volatility as further Q3 earnings reports are published, which could exert pressure on JPMorgan shares depending on prevailing market sentiment.
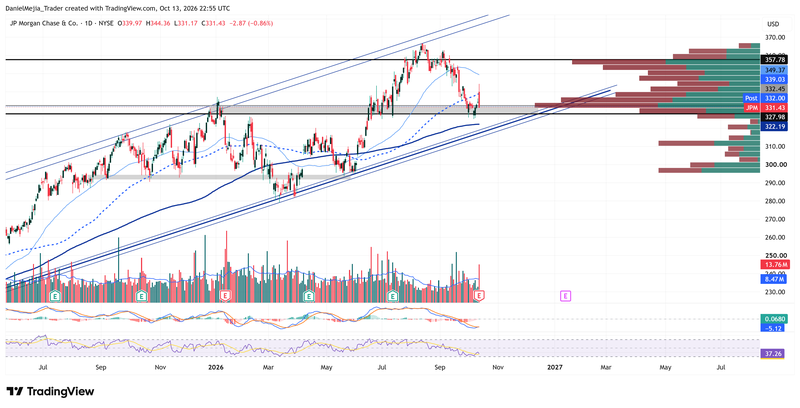
Figure 1. JPMorgan’s Share Price (2025–2026). Source: Data from the NYSE Exchange; author's analysis conducted via TradingView.


