Help
Can Microsoft price breaks above $550?
Azure is growing faster than AWS and demand still exceeds capacity. That supports Microsoft’s case for AI spending, but maintaining the lead is becoming more expensive.
Microsoft is expected to report quarterly revenue of about $90.64 billion.
Microsoft is one of the world’s leading corporate bond issuers, yet it has historically borrowed less than many of its mega-cap technology peers.
The real test is whether new capacity can sustain growth without pushing margins and free cash flow lower.
Azure gives Microsoft a stronger defence for its spending
Microsoft enters its fiscal first-quarter results with an advantage: investors can already see a direct link between infrastructure investment and cloud growth. Microsoft Cloud revenue reached $59.3 billion in the previous quarter, up 27%, while Azure and other cloud services grew 43%. Azure also surpassed the annual revenue run rate of $100 billion.
That makes Microsoft’s spending easier to justify than investment in products whose future revenue remains uncertain. Management said demand continued to exceed available capacity and that new Azure capacity brought online during the quarter was monetized quickly.
Microsoft also has an advantage in how it finances that expansion
It is one of the world’s leading corporate bond issuers, yet it has historically borrowed less than many of its mega-cap technology peers. Its financial strength gives it greater flexibility to fund infrastructure investment without relying heavily on additional debt issuance.
For investors, the distinction matters: Microsoft must still prove that AI spending generates attractive returns, but it has a stronger balance sheet to support the investment while those returns develop.
Microsoft’s deeper advantage is distribution
Its early OpenAI investment gave Azure a head starts in generative AI, while Microsoft could place the technology inside products companies already used, including Microsoft 365, GitHub and Dynamics. That shortened the distance between infrastructure investment and commercial adoption.
The capex ratio needs careful interpretation
Microsoft paid $35.8 billion for property and equipment during the quarter, equivalent to 39.8% of its $90.0 billion revenue. Including finance leases, however, capital expenditure reached $41 billion, lifting the broader ratio to about 45.6%.
Meta’s latest quarterly capex of $34.91 billion represented roughly 54% of its $64.6 billion revenue. Alphabet’s comparable ratio was about 37.5%, based on $44.9 billion capex and $119.8 billion of revenue. Alphabet was therefore slightly below Microsoft on a cash-capex basis, rather than above it.
The comparison helps explain why markets treat companies differently
A capex ratio measures how much is being spent, not how productively the money is being used. Microsoft can point to Azure growth, a $678 billion commercial backlog and enterprise customers paying for cloud and software services. It must prove those revenues can outgrow the cost of delivering them.
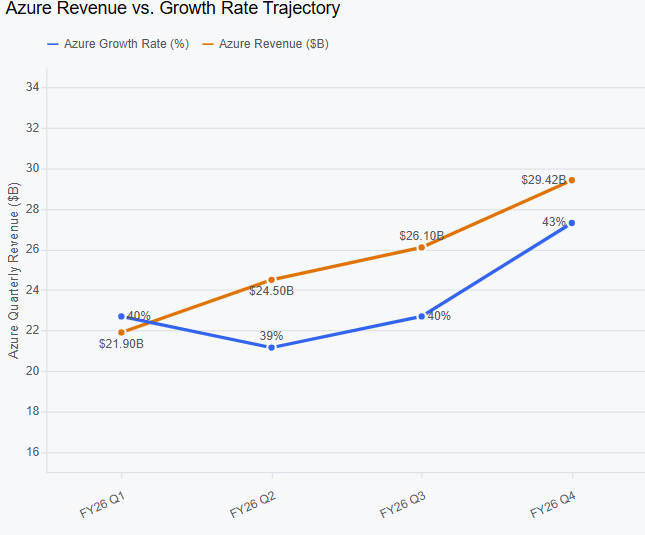
Source: ChatGPT – Authors idea
Growth is beginning to carry a heavier cost
Two-thirds of Microsoft’s quarterly capex went towards shorter-lived assets such as CPUs and GPUs. These assets monetize quickly but require faster replacement and create continuing depreciation pressure. Microsoft Cloud’s gross margin fell to 65% from 68% a year earlier, showing that rapid Azure growth does not arrive without cost.
Microsoft is expected to report approximately $90.64 billion of revenue. A beat would support the demand story, but guidance will decide whether the spending still looks productive.
Stable margins, strong Azure growth and better free cash flow would suggest Microsoft is converting its AI lead into operating leverage.
Another increase in capex alongside weaker margins would tell a different story: Microsoft may still be winning cloud demand but paying more each quarter to remain ahead.
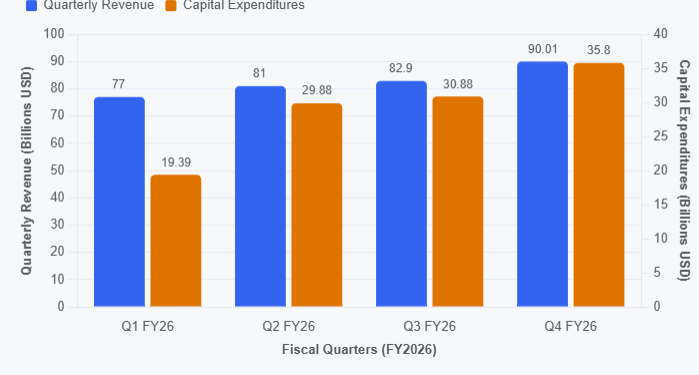
Source: ChatGPT – Authors idea
Technical outlook
Microsoft recovered from a sharp correction towards $345.50, where horizontal support coincided with the rising long-term trendline. Buyers stepped back in, pushing the stock above $400 and then $470, restoring the broader bullish structure.
The recovery has now brought the price back to $549.71, close to its previous high. This is where the rally faces its next test. A sustained break above $550 would suggest buyers have absorbed the earlier selling pressure. Another rejection, however, could leave the stock vulnerable to profit-taking, particularly ahead of earnings.
The rising moving average near $443 continues to support the longer-term trend. Still, the speed of the rebound from the $350–360 area leaves room for a pullback without necessarily undermining the broader bullish picture.
A decisive break above $549.70–550 would put $570–580 in view, with $595–600 becoming a possible next target if buying momentum holds.
If the stock fails to clear resistance, a pullback towards $520–530 would be the first test. A break below $470–475 would weaken the recovery and bring the $443 moving average into focus, followed by support around $395–400.
Microsoft’s broader trend remains bullish, but the stock is approaching a major resistance level just as earnings arrive. A move above $550 would strengthen the case for another leg higher. Until that happens, the combination of elevated expectations and a sharp prior recovery leaves room for volatility, especially if the results or forward guidance fail to justify the market’s optimism.
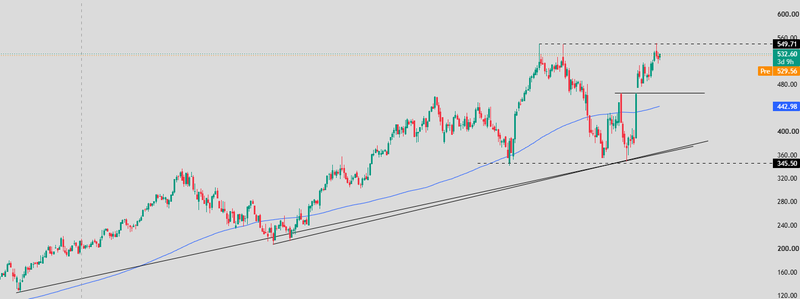
Source: Trading view