
 Help
Help Nvidia shares surge following strong quarterly earnings and robust growth
Nvidia shares surged 8.74% after surpassing second-quarter earnings estimates, driven by solid, AI-led growth within its Data Centre segment. Robust top-line revenue, high operating margins, and strong third-quarter guidance supported Nvidia’s overall market capitalisation.

Nvidia’s quarterly revenue reached $96.2 billion (up 105% YoY), while earnings per share (EPS) hit $2.22, exceeding consensus estimates.
Data centre revenue spiked 117% YoY to $89 billion, powered by sustained demand for artificial intelligence products.
Profitability margins demonstrated strong operational efficiency, recording a 66% operating margin and a 62% net margin.
Date: 27 August 2026
What is driving Nvidia shares higher following its solid quarterly performance?
Nvidia Corporation shares advanced by 8.74% to trade at $227.98 following the release of a solid second-quarter earnings report. Consequently, Nvidia’s market capitalisation reached a threshold of $5.52 trillion, reclaiming its status as the most valuable company in both the United States and global markets.
The company comfortably surpassed analysts’ expectations for both total revenue and earnings per share. The semiconductor leader reported quarterly revenue of $96.2 billion, beating the market forecast of $91.9 billion. Concurrently, earnings per share arrived at $2.22, topping the consensus estimate of $2.08. These figures represent a year-on-year (YoY) revenue expansion of 105% alongside a 111% YoY increase in EPS. In addition, management issued third-quarter revenue guidance of $108 billion, further outperforming market expectations.
Segmental performance was anchored by the Data Centre division, which generated $89 billion in revenue—reflecting a YoY growth rate of 117%. Meanwhile, the edge computing segment produced $7.2 billion, registering a 27% YoY increase. In this context, sustained momentum in artificial intelligence-related offerings continues to serve as the primary catalyst driving continuous top-line expansion.
Additionally, operational efficiency remained high, with Nvidia reporting operating income of $63.73 billion, translating to an operating margin of 66%. Net income reached $59.69 billion, yielding a net margin of 62%. Both metrics demonstrate strong earnings power and reinforce the structural strength of the quarterly earnings report.
Finally, market valuation metrics present a nuanced narrative. According to data from Yahoo Finance, the price-to-earnings (P/E) ratio stands at 32.11x, paired with a price/earnings-to-growth (PEG) ratio of 0.58x, suggesting that robust earnings growth is supporting rising market capitalisation. Conversely, the company's price-to-book (P/B) ratio of 25.98x suggests a degree of overvaluation relative to its industry peers. According to Investing.com, the industry average P/B ratio stands at 12.4x, indicating that the stock is trading at a substantial premium to the sector and potentially reflecting heightened investor expectations regarding future growth and profitability.
Technical analysis of Nvidia’s share price
From a technical perspective, Nvidia’s primary long-term trend remains fundamentally bullish. A closer inspection of the current market structure reveals several key nuances:
- Trend Context: Over an extended horizon, Nvidia retains a bullish market structure defined by a consistent sequence of higher highs and higher lows. The shares continue to trade comfortably above their 50-day, 100-day, and 200-day Simple Moving Averages (SMAs), reinforcing the upward momentum.
- Resistance Levels: Should the current bullish impulse persist, the next major technical ceiling rests at the record high of $235. A decisive breakout above this level could signal entry into a fresh price discovery phase, notably the psychological barrier of $250.
- Support Levels: If immediate short-term support at $224 is invalidated, the next structural floor is identified at $210, a critical convergence zone for both the 50-day and 100-day SMAs. A breach of this $210 cushion would elevate the probability of a deeper market correction towards the 200-day SMA support near $195.
- Momentum Indicators: Both the Moving Average Convergence Divergence (MACD) and the Relative Strength Index (RSI) are trading in neutral territory, suggesting an absence of a predominant short-term directional bias. Consequently, fundamental factors are expected to drive near-term market direction.
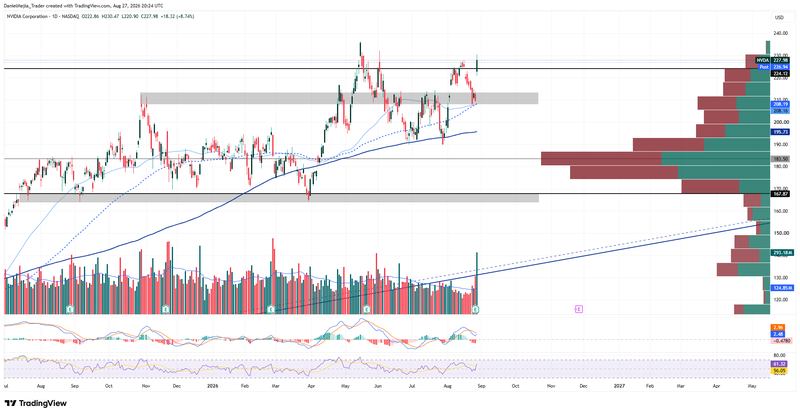
Figure 1. Nvidia’s Share Price (2025–2026). Source: Data from the Nasdaq Exchange; author's analysis conducted via TradingView.


