
 Help
Help Oracle posts robust quarterly results; shares rise in after-hours trading
Oracle reported strong quarterly results, exceeding both revenue and earnings per share (EPS) forecasts. Shares rose by approximately 4% in post-market trading, driven by solid demand for data centre infrastructure and robust forward guidance, despite technical resistance in recent price action.

Oracle surpassed market expectations with $19.34 billion in revenue and $1.92 in EPS, driving an approximate 4% post-market rally.
Revenue and EPS expanded by roughly 30% year-on-year, supported by accelerating data centre demand.
Full-year revenue is projected at $90 billion, matching optimistic forward growth forecasts.
Technical indicators point to potential short-term upward momentum, despite the stock trading below its 200-day simple moving average.
Date: 10 September 2026
Oracle exceeds analysts' forecasts for revenue and EPS in solid earnings report
Oracle Corporation surpassed market expectations for both total revenue and earnings per share (EPS) in its latest quarterly earnings report. The technology giant reported revenue of $19.34 billion, exceeding the market consensus forecast of $19.13 billion. Concurrently, the company posted EPS of $1.92, comfortably beating analysts' estimates of $1.73. These figures represent year-on-year (YoY) growth rates of 29.5% in revenue and 30.6% in EPS. Consequently, following this solid financial report, Oracle's shares advanced by approximately 4% in extended post-market trading.
Regarding Oracle's expectations for the upcoming fiscal quarter, the firm projected earnings per share within a range of $1.85 to $1.93, implying a YoY growth rate of between 30% and 34%. This guidance converges closely with consensus estimates of $1.89. Furthermore, for the full fiscal year, the company anticipates revenue of $90 billion, surpassing analysts' estimates of $89.76 billion—as quoted by CNBC. Implied expectations suggest that Oracle foresees sustained performance over upcoming quarters, primarily propelled by rising demand across its data centre segment.
Meanwhile, Oracle's valuation metrics remain broadly in line with industry levels. According to Investing.com, the company's price-to-earnings (P/E) ratio stands at 26.52x, modestly above the industry average of 20.6x, suggesting that investors are willing to pay a premium for its earnings potential. In contrast, Oracle's price-to-sales (P/S) ratio of 6.27x remains below the industry average of 10.89x, indicating that its revenue valuation is relatively restrained compared with industry peers.
Technical analysis of Oracle’s share price
From a technical perspective, the primary long-term trend for Oracle’s shares remains fundamentally bullish. A closer inspection of current price action reveals several key structural nuances:
- Trend Context: Over an extended horizon, Oracle maintains a bullish market structure defined by a consistent sequence of higher highs and higher lows. In the short term, however, substantial selling pressure has precipitated a 50% drawdown from its record high. Consequently, shares continue to trade below their 200-day Simple Moving Average (SMA), signalling that long-term bullish momentum has not yet fully recovered.
- Resistance Levels: Should price action breach the 200-day SMA to the upside, the primary technical ceiling sits at $203—a zone that converges with the Volume Profile’s Value Area High (VAH). A decisive breakout above this mark could signal potential expansion into a higher valuation zone.
- Support Levels: If immediate support at $150 fails to hold, the next primary structural floor is situated at $122. A breakdown below these zones would heighten the probability of a deeper correction. Crucially, the $150 support level represents a robust technical floor, as a long-term bullish trendline converges with the Volume Profile’s Point of Control (POC).
- Momentum Indicators: Both the Moving Average Convergence Divergence (MACD) and Relative Strength Index (RSI) indicators are signalling an upward trajectory, suggesting that short-term bullish momentum may persist. Nevertheless, fundamental and macroeconomic catalysts are expected to remain the primary drivers of near-term market direction.
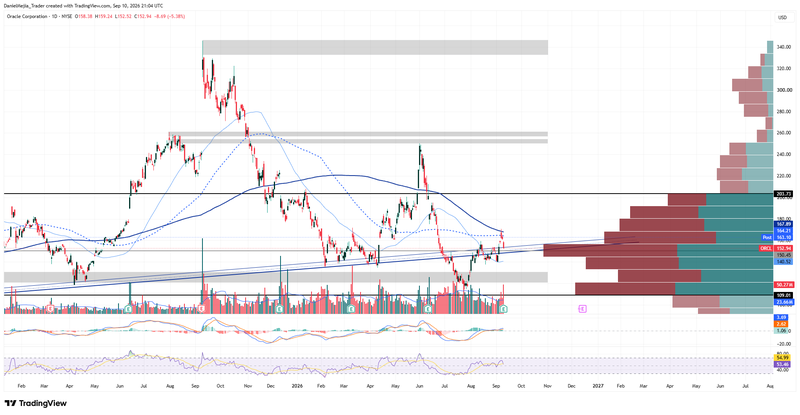
Figure 1. Oracle’s Share Price (2025–2026). Source: Data from the Nasdaq Exchange; author's analysis conducted via TradingView.


