
 Help
Help Palantir Q2 2026 earnings: a fundamental and technical overview
Palantir's strong Q2 2026 report beat estimates with 93% revenue growth, driving shares up 37%. Despite high valuations, robust fundamentals and technical momentum support its ongoing bullish trajectory.

Palantir’s Q2 2026 revenue reached $1.94 billion and EPS hit $0.41, surpassing consensus market expectations.
Year-on-year revenue grew 93% and EPS surged 156%, whilst net margins improved to 47.5%.
Share price jumped 37% to $172.73 following earnings, bringing market capitalisation to $415 billion.
High valuation ratios (99x P/E, 29x P/B) and overbought indicators suggest caution regarding ongoing bullish momentum.
Date: 25 August 2026
Palantir releases a solid financial report for Q2 2026
Palantir Technologies released a strong Q2 2026 financial report on 3 August, exceeding analysts’ forecasts for both total revenue and earnings per share (EPS). The technology giant reported revenue of $1.94 billion, surpassing the estimate of $1.81 billion. In turn, the firm reported EPS of $0.41, beating the market consensus forecast of $0.34. This reflects a year-on-year (YoY) revenue growth rate of 93% alongside a 156% YoY surge in earnings per share.
Since the publication of the earnings report, Palantir’s shares have increased by approximately 37%, reflecting the firm's consistently solid historical financial performance. Palantir’s shares are currently trading at $172.73, bringing its market capitalisation to $415 billion.
Financial overview of Palantir Technologies
Palantir’s revenue performance has demonstrated a solid upward trajectory, most notably since Q2 2025. The YoY growth rate maintains an increasing slope through 93%—an exceptional performance for mega-capitalisation companies. The firm's average revenue growth rate remains close to 38%, which recent quarters have comfortably surpassed. Net income performance likewise maintains strong upward momentum, achieving an average growth rate of 111%. Additionally, average net margins have improved to 47.5% over the past four quarters, sustaining a rising trend that initiated in Q1 2023.
Meanwhile, investment performance reveals significant expansion as total assets have reached $11.68 billion. This underlying growth has been driven by operational efficiencies, as the debt-to-assets ratio has declined to 1.8%. In this context, robust operational cash flow has supported sustained investment flows, all whilst total debt remains well contained.
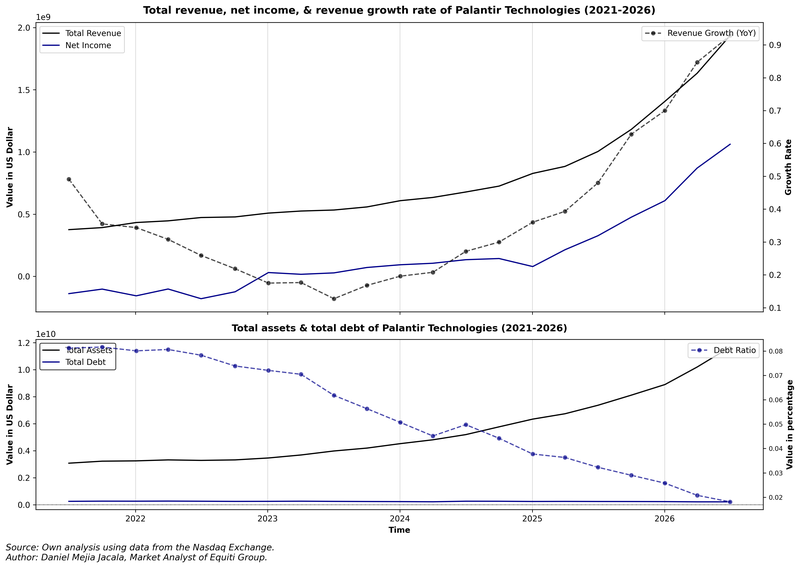
Figure 1. Palantir’s Revenue, Net Income, Total Debt, & Total Assets (2021–2026). Source: Author's analysis based on data from the Nasdaq Exchange.
However, valuation ratios signal caution: the price-to-earnings (P/E) ratio has reached 99x, whilst the price-to-book (P/B) ratio remains close to 29x. In this context, strong market interest in acquiring Palantir shares remains underpinned by solid fundamentals, even though valuation metrics indicate overvalued territory.
Technical analysis of Palantir shares
From a technical perspective, Palantir’s share price maintains a long-term bullish trend. Primary structural observations include:
- Trend Context: On long-term timeframes, Palantir preserves a market structure defined by a consistent sequence of higher highs and higher lows. The price continues to trade comfortably above its 50-, 100-, and 200-day Simple Moving Averages (SMAs), confirming underlying upward momentum.
- Resistance Levels: Should the resistance level at $178 be breached to the upside, the next critical barrier sits at $207—the all-time high. A decisive breakout and close above these market zones would open the path towards higher valuation levels.
- Support Levels: If immediate support at $178 fails to hold, the primary structural floor is identified at $151, where the 200-day SMA converges. A failure to defend this underlying support would significantly increase the probability of a deeper market correction, notably through the $145 zone.
- Momentum and Volume: Both the Moving Average Convergence Divergence (MACD) and the Relative Strength Index (RSI) are currently situated in overbought territory, pointing to a potential market retracement or consolidation phase. Nevertheless, fundamental factors are expected to remain the predominant driver of future market direction.
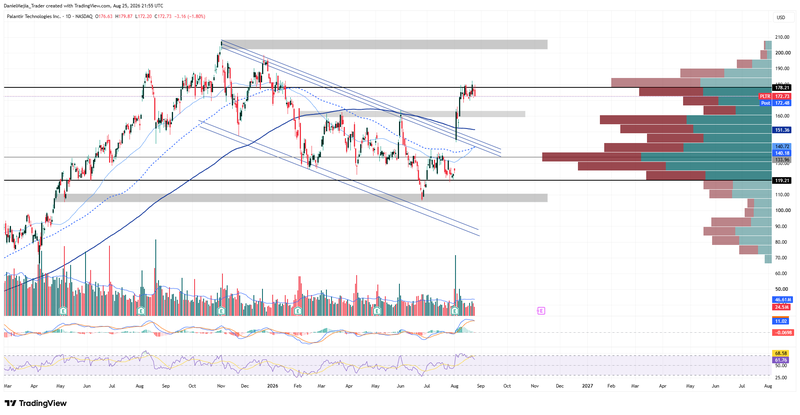
Figure 2. Palantir Share Price (2025–2026). Source: Data from the Nasdaq Exchange; Author's analysis conducted via TradingView.


