
 Help
Help Palo Alto quarterly earnings: a fundamental and technical overview
Palo Alto Networks exceeded revenue and EPS expectations on its quarterly earnings report, but shares have been pressured by consecutive quarterly net losses and elevated valuation metrics.

Palo Alto surpassed consensus estimates with $3.41 billion in revenue and $1.02 EPS, reflecting solid 34% YoY top-line growth.
Shares have dropped 7.46% as investors reacted to two consecutive quarters of contracting net income.
High valuation metrics, including an 835x P/E ratio, drive market scrutiny despite low leverage risk.
Date: 10 September 2026
Why have Palo Alto’s shares declined despite a solid earnings report?
Palo Alto Networks released its quarterly earnings report on 1 September, exceeding consensus estimates for both total revenue and earnings per share (EPS). The technology firm reported revenue of $3.41 billion, surpassing market consensus forecasts of $3.35 billion. Furthermore, the company posted Non-GAAP diluted earnings per share of $1.02, outperforming analyst expectations of $0.98. These results represent a year-on-year (YoY) revenue growth rate of 34% and a 7.3% YoY increase in EPS.
Nevertheless, despite publishing better-than-expected results, Palo Alto's shares have declined by 7.46% over the course of approximately one week. This contraction can be attributed to a quarterly GAAP net loss, marking two consecutive quarters of net losses.
Financial overview of Palo Alto Networks
Palo Alto’s revenue performance has demonstrated sustained strength over recent years, particularly over the last two quarters, during which top-line growth reached 31% and 34%, respectively. Against this backdrop, the average revenue growth rate improved to an average of 21.8%. However, net income performance has faced headwinds, with the firm reporting GAAP net losses over the past two quarters. Average net income growth remains close to 4.4% over the evaluated period.
Meanwhile, balance sheet assets reflect robust growth, particularly over the last two quarters, with total assets reaching $48.46 billion—nearly double the levels recorded in preceding periods. This asset expansion has coincided with a declining debt-to-assets ratio, which has fallen to 5%. Consequently, leverage risk remains well contained.
Nevertheless, valuation metrics remain elevated. According to Investing.com, the price-to-earnings (P/E) ratio of Palo Alto stands near 835x, substantially exceeding the industry average of 20.5x. Similarly, the price-to-book (P/B) ratio is approximately 10.6x, compared with the industry metric of 6.7x. These high valuation multiples could be contributing to recent market capitalisation contraction, particularly in a context where market participants are subjecting technology earnings to heightened scrutiny.
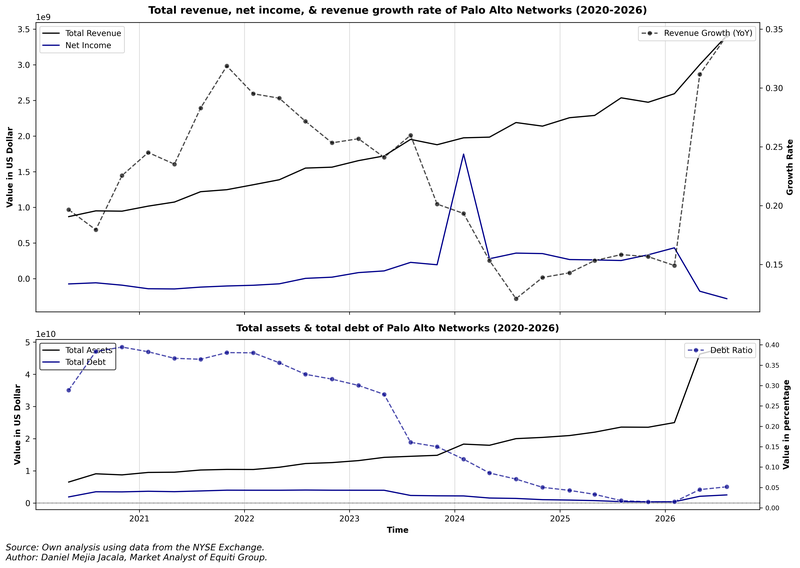
Figure 1. Palo Alto’s Revenue, Net Income, Total Debt, & Total Assets (2020–2026). Source: Author's analysis based on data from the Nasdaq Exchange.
Technical analysis of Palo Alto’s share price
From a technical perspective, the primary long-term trend for Palo Alto’s shares remains fundamentally bullish. A closer inspection of current price action reveals several key structural nuances:
- Trend Context: Over an extended horizon, Palo Alto maintains a bullish market structure defined by a consistent sequence of higher highs and higher lows. Shares continue to trade comfortably above their 50-day, 100-day, and 200-day Simple Moving Averages (SMAs), reinforcing broader upward momentum. In the short term, however, price action reflects a pullback as the stock tests a key support level.
- Resistance Levels: Should price action hold and rebound from immediate support near $320, the primary technical ceiling is $396—its record high. A decisive breakout above this mark could signal potential expansion into uncharted territory.
- Support Levels: If immediate support at $320 fails to hold, the next structural technical floors lie at $290 and $235—levels where the 100-day and 200-day SMAs reside, respectively. A breakdown below these zones would heighten the probability of a deeper correction.
- Momentum Indicators: The Moving Average Convergence Divergence (MACD) and the Relative Strength Index (RSI) indicators are signalling a downward trajectory, suggesting that short-term bearish pressure may persist. Nevertheless, fundamental and macroeconomic catalysts are expected to remain the primary drivers of near-term market direction.
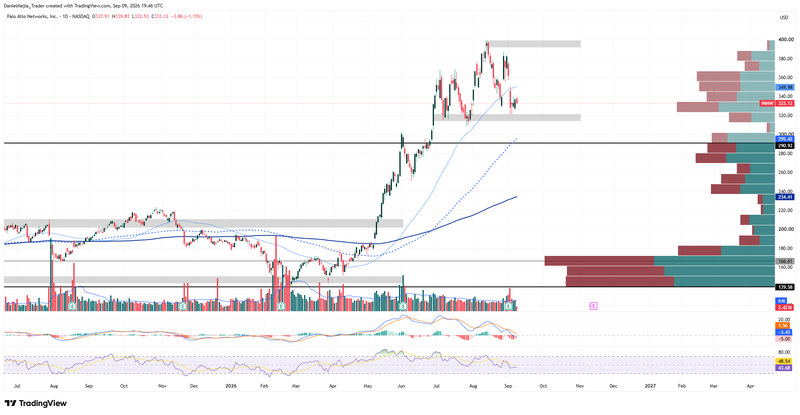
Figure 2. Palo Alto’s Share Price (2025–2026). Source: Data from the Nasdaq Exchange; author's analysis conducted via TradingView.


