
 Help
SpaceX posts robust Q3 earnings results, lifting shares in post-market trading
SpaceX achieved robust third-quarter results, surpassing market forecasts with $14.58 billion in revenue and earnings per share (EPS) of $0.35, largely driven by rapid expansion within its artificial intelligence segment.

SpaceX’s third-quarter revenue surged by 161% year-on-year to $14.58 billion, generating $4.4 billion in net income.
The artificial intelligence (AI) segment generated $7.56 billion, accounting for 52% of total third-quarter revenue and 84% of total capital expenditure (CAPEX).
The connectivity segment generated $2.37 billion, contributing the largest share of operating income at 85%.
Shares advanced by approximately 9% in after-hours trading, supported by solid underlying fundamentals and a shift to profitability.
Date: 21 October 2026
Can strong Q3 earnings fuel SpaceX's share price advance?
SpaceX (SPCX) published a robust third-quarter earnings report, comfortably surpassing market forecasts across both top-line revenue and earnings per share (EPS). The company reported total revenue of $14.58 billion, significantly exceeding the market consensus estimate of $12.87 billion. Simultaneously, EPS came in at $0.35, substantially outperforming the projected $0.13 figure.
According to SpaceX's quarterly report, total revenue reflected a year-on-year (YoY) expansion of 161%. This performance was primarily propelled by an 829% surge in its artificial intelligence (AI) division, alongside accelerated growth in its connectivity segment, which rose by 69%. Specifically, the AI segment expanded from $813 million in Q3 2025 to $7.56 billion in Q3 2026. Meanwhile, the connectivity segment advanced from $3.10 billion to $5.25 billion, while space operations grew modestly from $1.67 billion to $1.77 billion.
Furthermore, the company delivered strong operational metrics, generating $2.8 billion in operating income, $4.4 billion in net income, and $8.8 billion in adjusted EBITDA. This represents a decisive financial recovery, noting that SpaceX recorded operating losses and a net loss of $1.1 billion in the third quarter of 2025.
An analysis of the third-quarter segmental breakdown reveals distinct operational dynamics. In terms of top-line revenue, AI accounted for the largest share at 52%, followed by connectivity at 36% and space at 12%. However, connectivity was the primary contributor to operating income, representing 85%, while AI contributed 15% and space registered a negligible operating footprint. Regarding capital expenditure (CAPEX) allocation, the AI segment absorbed 84% of total outlays, followed by space at 8.2% and connectivity at 7.8%. These allocations demonstrate SpaceX's strategic pivot towards building a diversified commercial foundation while aggressively capitalizing on expanding demand within the AI landscape.
Consequently, following the publication of these financial results, SpaceX shares advanced by approximately 9% in after-hours trading.
Technical analysis of SpaceX shares
Given the limited historical trading data available for an extended technical assessment, this evaluation focuses exclusively on five-month price action. Key technical observations include:
- Trend Context: SpaceX shares have maintained a sustained upward trajectory over the past two months. However, recent selling pressure has driven the price back towards the Volume Profile’s Point of Control (POC) region. This zone is particularly significant as it sits near the stock's Initial Public Offering (IPO) opening price.
- Momentum Indicators: Both the Moving Average Convergence Divergence (MACD) and the Relative Strength Index (RSI) display downward trajectories, indicating that short-term bearish momentum may persist. Nevertheless, SpaceX's robust underlying fundamentals triggered a sharp post-market rally, which could invalidate these short-term technical patterns.
- Resistance Levels: Should bullish momentum re-emerge, the immediate upside technical ceiling sits at $170, where structural resistance converges with the Volume Profile’s Value Area High (VAH). A decisive break above this barrier would open the probability that the price could increase towards $202—the stock's record high level.
- Support Levels: In the event of a price retracement, key support lies at $140.50 and $132.50, corresponding to the 50% and 61.8% Fibonacci retracement levels of the most recent bullish impulse. Crucially, the $132.50 level aligns with the Volume Profile’s Value Area Low (VAL), strengthening this technical support floor.
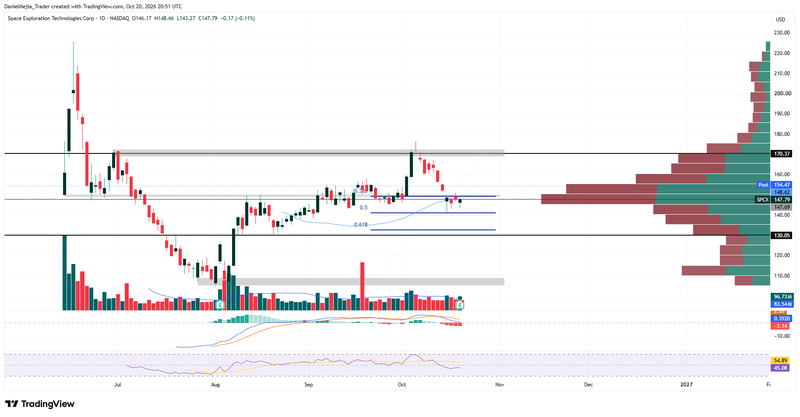
Figure 1. SpaceX Share Price (2026). Source: Data from the Nasdaq Exchange; author's analysis conducted via TradingView.


