
 Help
Help Tesla beats revenue expectations but misses EPS estimates in Q2 2026
Tesla reported Q2 2026 revenue of $28.24 billion, surpassing market expectations, but missed earnings per share (EPS) forecasts with a reading of $0.33. Shares fell 4% in post-market trading amid rising operational costs and ongoing selling pressure.

Q2 revenue reached $28.24 billion, topping consensus expectations and reflecting a 25.5% year-on-year (YoY) expansion.
EPS declined 17.5% YoY to $0.33, missing the $0.49 analyst forecast due to persistent operational cost pressures.
Shares slid 4% in post-market trading as net income growth remains constrained by elevated expenditure.
Date: 22 July 2026
Tesla exceeds revenue expectations in Q2 2026 but misses on earnings, with shares sliding in the post-market session
Tesla Inc. released mixed Q2 2026 financial results, surpassing top-line revenue estimates while falling short of bottom-line EPS forecasts. The automotive giant reported total revenue of $28.24 billion, exceeding analysts' projections of $25.55 billion. Conversely, the firm generated earnings per share of $0.33, below the consensus estimate of $0.49. These figures represent a YoY revenue growth rate of 25.5%, but an annual EPS contraction of 17.5%. Consequently, Tesla’s shares declined by 4% during the post-market trading session.
Financial overview of Tesla
Financial performance metrics for Tesla presents a mixed trajectory. On one hand, revenue maintains an ascending momentum, even as growth rates have decelerated over recent quarters. However, this growth trajectory has shown improvement since Q2 2025, recovering along an upward path. Notably, the Q2 2026 growth rate reinforces this positive momentum (+25.5%), aligning closely with the historical average performance of 26%.
Nevertheless, net income reflects a sharp easing, remaining near a historical growth rate of 2%. Since Q4 2024, the net income growth rate has posted negative readings, suggesting that expanding profitability is becoming increasingly complex for the electric vehicles (EV) manufacturer. Historically, the cost of goods sold (COGS) represents the largest proportion of total sales, exerting downward pressure on operating and net benefit margins.
Conversely, asset management metrics indicate strong asset growth, supported by a solid upward trend. Meanwhile, the debt management exhibits continuous improvement, bringing the debt ratio down to 11%.
In summary, Tesla demonstrates structural health across revenue, asset expansion, and debt risk management, but bottom-line profitability remains under significant strain from operational cost pressures.
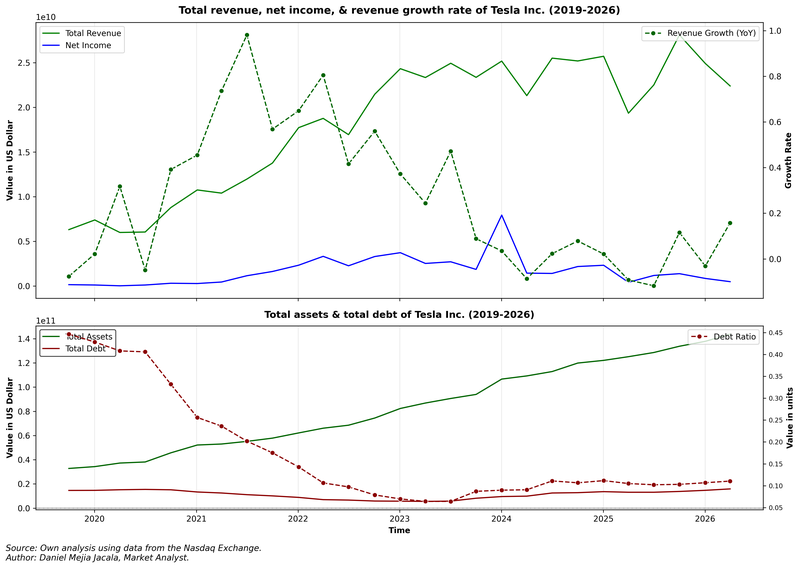
Figure 1. Tesla’s Revenue, Net Income, Total Debt, & Total Assets (2019–2026). Source: Own analysis using data from the Nasdaq Exchange.
Technical analysis of Tesla’s share price
Regarding the technical outlook, while Tesla’s share price preserves its primary long-term bullish trajectory, several short-term technical levels have been breached to the downside:
- Trend Context: Over the long term, Tesla Inc. maintains a market structure defined by a sequence of "higher highs" and "higher lows". Nevertheless, the equity trades below its 50, 100, and 200-day Simple Moving Averages (SMAs), reinforcing short-term bearish momentum. Year-to-date (YTD), price action remains bound within a sideways consolidation range.
- Resistance Levels: Should price action breach the short-term resistance at $435—a level currently coinciding with the downward trendline and the Volume Profile’s Point of Control—the next major technical ceiling is the historical peak of $490. A decisive close above this level would likely signal the commencement of a new expansionary phase toward higher price targets.
- Support Levels: If immediate support at $365 fails, the next critical floor is identified at $340. A failure to defend the $340 zone would significantly heighten the probability of a deeper market correction.
- Momentum Indicators: Both the Moving Average Convergence Divergence (MACD) and the Relative Strength Index (RSI) are hovering near neutral levels, reflecting a lack of a clear directional bias at present. However, both technical metrics exhibit a downward trajectory, suggesting the potential for renewed selling pressure.
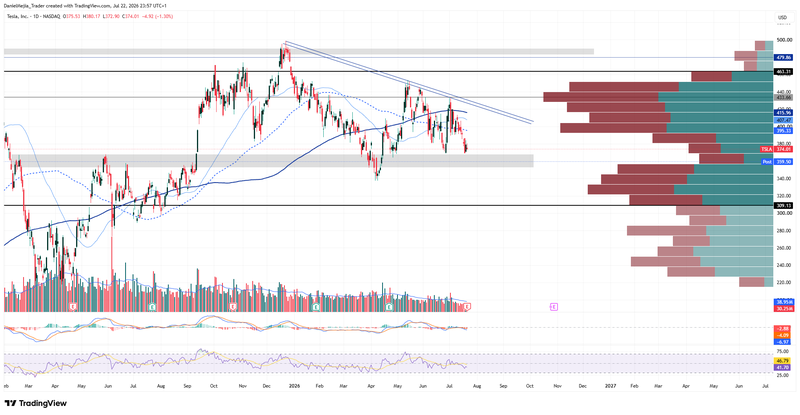
Figure 2. Tesla’s Shares (2025–2026). Source: Data from the Nasdaq Exchange; Own analysis conducted via TradingView.


