Amazon breaks below key technical level as selling pressure persists
Amazon shares remain under pressure, down 11% from their record high, as strong US labour market data, inflation concerns, and rising tensions between Israel and Iran reinforce expectations of tighter Federal Reserve policy.

Amazon has fallen 11% from its record high as investors respond to inflation risks and expectations of higher-for-longer Federal Reserve interest rates.
Strong US payroll data reduced the case for interest rate cuts, while CME FedWatch indicates rising odds of rate increases later this year.
Tensions between Israel and Iran, together with threats to shipping in the Red Sea, have added to inflationary and supply-chain concerns, weighing on market sentiment.
Amazon drops below key technical level amid ongoing selling pressure
Amazon is facing continued selling pressure amid rising inflation concerns and growing expectations that the Federal Reserve could adopt a more restrictive stance in order to contain prices. According to CME’s FedWatch Tool, market-implied probabilities suggest that an interest rate hike at the December meeting remains the most likely outcome, indicating that expectations of lower interest rates have weakened. For the October meeting, CME’s tool shows a 42% probability of a rate increase.
This market environment intensified following the Bureau of Labor Statistics (BLS) report last Friday, which showed a robust US employment sector, most notably with non-farm payrolls exceeding expectations. A scenario in which inflationary pressures remain elevated while employment conditions stay firm suggests that lower interest rates from the US central bank could not be required.
In addition, rising geopolitical tensions between Israel and Iran are generating renewed concerns that the conflict could re-escalate and develop into a broader regional dispute. According to Reuters, Israel struck an Iranian petrochemical facility over the weekend, which it said had been involved in the production of ballistic missiles. In turn, Iran responded with missile attacks targeting Israeli sites. Meanwhile, Houthi forces in Yemen stated that they would restrict vessels linked to Israel in the Red Sea—a vital maritime corridor for the energy supply chain between Europe and Asia—which could represent a further deterioration in the conflict.
Taken together, this backdrop is affecting Amazon’s shares, which have declined by 11% from their record high. At the same time, price action is exhibiting a reversal pattern that could imply a deeper contraction if geopolitical tensions further aggravate existing inflation concerns.
Technical analysis of Amazon’s shares
From a technical perspective, Amazon’s share price maintains its primary long-term bullish trajectory. Key observations include:
- Trend context: Over the long term, Amazon preserves a market structure defined by a sequence of higher highs and higher lows. The share price is currently trading above its 100-day and 200-day Simple Moving Averages (SMAs), reinforcing the prevailing bullish momentum. Nevertheless, in the short term, the price is exhibiting a reversal pattern, specifically a double-top formation.
- Resistance levels: Should price action break above the immediate resistance at $255, the next significant technical level is identified at $275, which marks the record high. A decisive close above this level would likely initiate a new expansionary phase into uncharted valuation territory.
- Support levels: If the immediate support zone, where the 100-day and 200-day SMAs converge at $233, is invalidated, the next critical floor is located at $210, corresponding to the base of a bullish channel pattern. A failure to defend the $210 level would substantially increase the probability of a more pronounced market correction.
- Momentum and volume: The Moving Average Convergence Divergence (MACD) is showing a downward slope while approaching the zero line, which could weaken bullish momentum further. By contrast, the Relative Strength Index (RSI) is currently trading near oversold territory, suggesting the possibility of a price rebound or a consolidation phase.
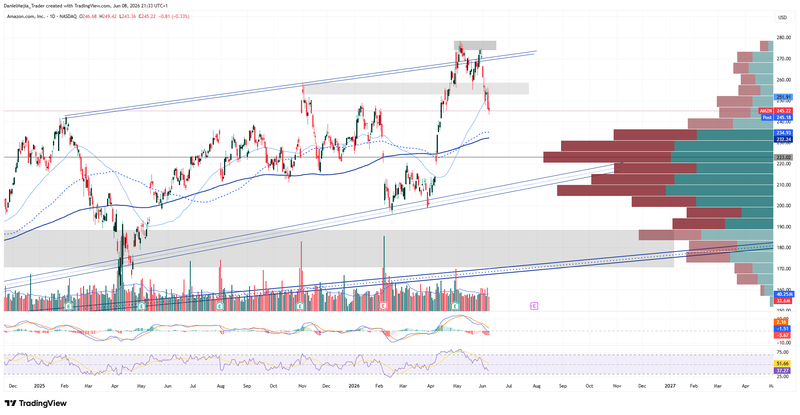
Figure 1. Amazon’s Share Price (2025–2026). Source: Data from the Nasdaq Exchange; own analysis conducted via TradingView.


