
 Help
Help AMD shares advance on strategic agreement with Microsoft around Helios system
Advanced Micro Devices (AMD) shares rose 1.58% to close at $503.57 following the announcement of a strategic partnership with Microsoft to deploy its integrated Helios AI system within the Azure cloud platform.
Microsoft will integrate AMD’s full Helios AI rack-scale system directly into its Azure data centres.
By supplying an integrated GPU, CPU, networking, and software stack, AMD is better positioned to challenge Nvidia’s market dominance.
Although AMD’s share price remains above key Simple Moving Averages (SMAs), declining RSI and MACD indicators signal waning short-term momentum.
Date: 20 July 2026
Microsoft–AMD deal on Helios lifts investor sentiment
Advanced Micro Devices (AMD) shares advanced 1.58% to $503.57 following the announcement of a strategic agreement with Microsoft. According to CNBC, Microsoft will deploy AMD's Helios AI system across its data centres as part of an ongoing expansion of its Azure cloud infrastructure. The agreement positions AMD as a more direct competitor to Nvidia by offering a fully integrated AI infrastructure system—combining GPUs, CPUs, networking, and software—rather than operating solely as a component chip vendor.
Nevertheless, Nvidia maintains a dominant market position, holding an estimated 95% share of the data centre GPU market, underpinned by its established hardware and software ecosystem. Amid this market dominance, AMD is seeking to capture a higher market share as it advances its position within the microprocessor industry.
Technical analysis of AMD’s share price
Regarding the technical outlook, AMD’s share price retains its primary long-term bullish trend. Key structural observations include:
- Trend Context: In the long term, AMD continues to exhibit a market structure characterised by higher highs and higher lows. The share price is trading comfortably above its long-term Simple Moving Averages (SMAs) across the 50, 100, and 200-day periods. However, momentum indicators—most notably the MACD and RSI—are currently following downward trajectories.
- Resistance Levels: Should the current bullish momentum persist, the next significant resistance level is identified at $580, representing the record high. A decisive breach above this ceiling would suggest the potential for further price expansion, with the $600 and $700 zones serving as the primary psychological technical zones.
- Support Levels: If the immediate short-term support at $445 is breached, the next key floor is situated at $300—a prominent psychological barrier that converges with the 200-day SMA. A failure to hold the $300 zone would heighten the probability of a broader market correction.
- Momentum Indicators: Both the Moving Average Convergence Divergence (MACD) and the Relative Strength Index (RSI) are signalling downward trends, suggesting that bullish momentum may be losing strength. Notably, the MACD is displaying a bearish divergence, which implies the potential for a short-term pullback or consolidation phase.
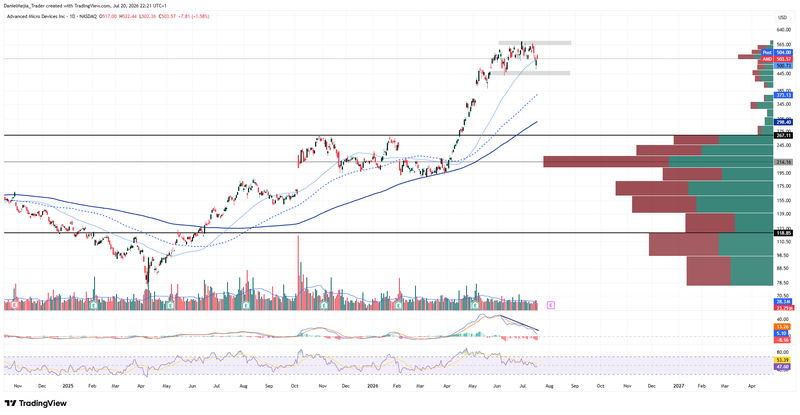
Figure 1. AMD Share Price (2025–2026). Source: Data from the Nasdaq Exchange; Own analysis conducted via TradingView.


