Help
Help Brent crude and US Treasury yields: A fundamental and technical analysis
Brent crude prices surged following renewed US-Iran tensions and the closure of the Strait of Hormuz, intensifying inflationary concerns and driving up US Treasury yields. Consequently, financial markets are increasingly pricing in a tighter Federal Reserve monetary policy stance to combat energy-driven inflation risks.

Brent crude jumped 9.59% to $83.30 per barrel as escalating US-Iran tensions and disruptions in the Strait of Hormuz threatened global oil supplies.
The yield on the benchmark 10-year US Treasury note rose to 4.62%, reflecting heightened inflation expectations and anticipated potential interest rate hikes.
The CME FedWatch Tool indicated a 43.3% probability of a rate hike in July and a 51.1% likelihood of further monetary tightening in September.
Historically, Brent crude returns and 10-year US Treasury yields exhibit a positive correlation, directly linking geopolitical energy shocks to broader macroeconomic inflation expectations.
Brent price jumps amid renewed US-Iran tensions in the Middle East
The Brent crude futures contract (BRNU6) rallied sharply following a significant re-escalation of geopolitical tensions between the United States and Iran, fuelling intense concerns over potential disruptions to energy supplies originating from the Middle East. Brent prices advanced 9.59% to close at $83.30 per barrel, marking their highest level within the past month.
Following a weekend characterised by military actions involving both nations, Iranian authorities announced the formal closure of the Strait of Hormuz—a strategically vital maritime corridor through which a substantial share of global oil shipments transits. Concurrently, the United States declared that the bilateral ceasefire agreement between the two nations had effectively collapsed.
According to Reuters, US President Donald Trump stated that Washington was reinstating its maritime blockade of Iranian shipping in the Gulf. In a post on Truth Social, Trump declared: "The Hormuz Strait is open and will remain open with or without Iran." Conversely, Iranian Foreign Minister Abbas Araqchi responded by asserting that "Tehran was the guardian of the Strait and would remain so forever", highlighting the increasingly confrontational stance adopted by both sides.
How oil prices influence bond yields via inflation expectations
Market participants traditionally associate rising oil prices with mounting inflationary pressures and subsequent restrictive monetary policy interventions by central banks. Reflecting this dynamic in the US fixed-income market, the yield on the 10-year Treasury note rose by 6.3 basis points to 4.62%, reaching its highest level since 19 May 2026. This upward movement indicates that investors are increasingly pricing in the likelihood of additional interest rate hikes by the Federal Reserve, as higher input energy costs risk feeding into broader inflationary pressures across the domestic economy.
Consistent with this market interpretation, the CME FedWatch Tool registered a 43.3% probability of a 25-basis-point interest rate increase at the Federal Reserve's upcoming July meeting, against a 56.0% probability that rates would remain unchanged. Looking further ahead, investors continued to assign the highest probability to a rate hike at the September meeting, with the implied likelihood standing at 51.1%. These shifts in forward-looking market expectations reflect growing anxieties that energy-driven inflation could compel the Federal Open Market Committee (FOMC) to maintain a highly restrictive monetary policy stance over the medium term.
From an empirical perspective, Figure 1 highlights the historical relationship between monthly Brent crude returns and monthly changes in 10-year US Treasury yields. Based on five-year rolling calculations, the analysis reveals a predominantly positive relationship between the two variables, particularly since 2011, when the Pearson correlation coefficient consistently exceeded the 20% threshold. From that period onwards, the correlation has generally remained statistically meaningful, fluctuating between moderate (above 20%) and relatively strong (above 40%) levels. The current correlation between Brent crude and 10-year Treasury yields stands at approximately 25%, indicating a moderate but positive relationship that has recently experienced renewed strengthening.
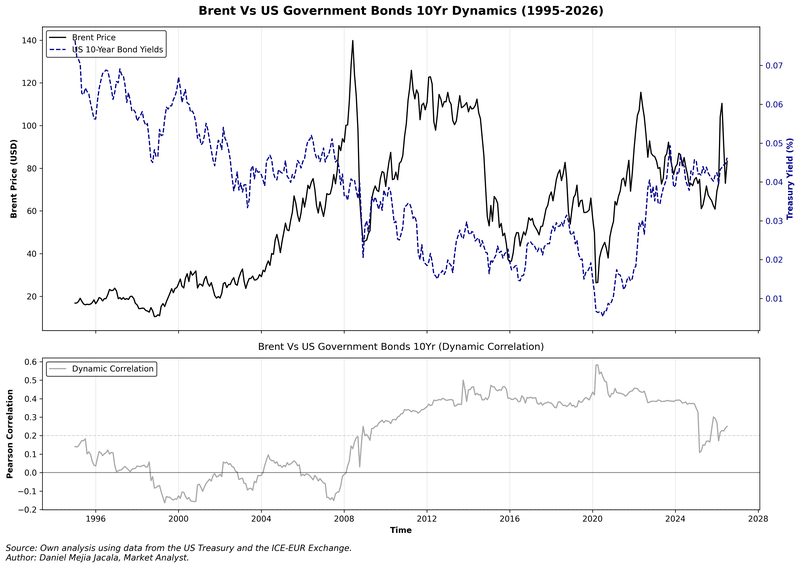
Figure 1. Brent Vs. Government Bond Yield 10-Year & Dynamic Correlation (1995–2026). Source: Own analysis using data from the US Treasury and the ICE-EUR Exchange.
It is worth noting that Brent crude was selected for this analysis because it is widely regarded as the premier international benchmark for oil prices and tends to be acutely sensitive to geopolitical developments in the Middle East. Furthermore, Brent remains highly relevant for assessing global energy market dynamics given the substantial structural dependence of European economies on crude exports originating from the Middle East region.
Technical analysis of the Brent futures contract
From a technical perspective, the Brent crude futures contract is navigating a highly volatile period of consolidation. A detailed breakdown of the current market architecture reveals several key observations:
- Trend Context: In the short term, the Brent contract has entered a highly volatile regime over recent months. From a structural standpoint, however, the contract continues to trade above its 200-day Simple Moving Average (SMA), suggesting that a primary bullish bias remains predominant.
- Resistance Levels: Should buyers reclaim immediate structural resistance at $87.00, the next major technical ceiling is identified at the $95.00 mark. This level represents a significant supply zone, as it reflects the volume profile’s Point of Control (POC) level of the current bullish regime.
- Support Levels: In the event that immediate short-term support at $71.50 fails to hold, the next significant structural floor is located at $68.00 per barrel—a prominent long-term structural support area. A decisive breakdown below this $68.00 pivot zone would materially increase the probability of a broader market correction.
- Momentum Indicators: Both the Moving Average Convergence Divergence (MACD) and the Relative Strength Index (RSI) are rising from deeply oversold territory. Notably, the MACD indicator is exhibiting a bullish crossover, signalling nascent positive momentum and a reinforcing price recovery. Furthermore, the RSI indicator is turning upwards, suggesting that short-term bullish momentum could gain further traction. However, it is highly anticipated that geopolitical and fundamental factors will remain the predominant drivers shaping future market movements.
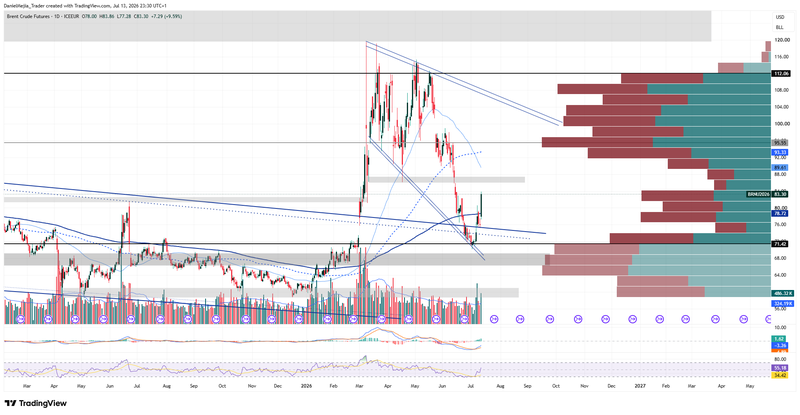
Figure 2. Brent Futures Contract (2025–2026). Source: Data from the ICE-EUR Exchange; own analysis conducted via TradingView.