
 Help
Help Brent crude surges above $100 as US-Iran tensions intensify
Brent crude has surged past $100 per barrel as military escalation between the US and Iran, alongside disruptions to Middle Eastern maritime corridors, has renewed concerns over global energy supply risks.

Brent futures rose 3.36% to $101.21 per barrel, crossing the $100 threshold for the first time since July.
Tensions escalated after Iran attacked ten US ships and launched ballistic missiles, following US strikes on Iranian oil tankers.
Disrupted transit through the Strait of Hormuz and the Bab el-Mandeb Strait continues to constrain global oil supply.
Date: 9 September 2026
Why is Brent crude rallying above the $100 threshold?
The Brent futures contract (BRNX6) rose by 3.36% to trade at $101.21 per barrel, exceeding the $100 threshold for the first time since July. This upward trajectory stems from escalating tensions between the US and Iran, which have reignited fears that ongoing global energy supply disruptions could deteriorate further.
According to Reuters reports, Iran declared that it had attacked ten vessels near the Strait of Hormuz following the US sinking five Iranian oil tankers. Furthermore, Iran stated that it had fired ballistic missiles at a US base within Jordanian territory. Concurrently, US President Donald Trump remarked that energy prices would not decline until after the midterm elections, saying that the war will end immediately after this period—as quoted by CNBC. This suggests that the conflict could persist for at least two additional months.
Against this backdrop, hostilities could experience a sharp escalation if military actions advance, disrupting what had been several weeks of relative moderation. Moreover, global energy supply disruptions risk worsening if both the Strait of Hormuz and the Bab el-Mandeb Strait remain impassable. Reports this week of bilateral exchanges between Houthi forces and Saudi Arabian military units reinforce concerns that energy flows through these critical maritime corridors could diminish further.
While energy flows through the Strait of Hormuz had shown signs of recovery in recent weeks, volumes remain below pre-conflict levels. Although crude transit improved during periods of relative geopolitical calm, ongoing friction has driven volumes back below the six-month conflict average. Consequently, oil producers have been forced to seek alternative commercial channels while energy supply remains constrained.
Looking ahead, market participants will remain focused on US–Iran tensions to gauge whether the conflict will further deepen existing supply disruptions and how long those disruptions will persist—particularly given that both the US and Iranian economies have sustained severe strain over the past six months of hostilities.
Technical analysis of the Brent futures contract
From a technical perspective, the Brent crude futures contract is navigating a highly volatile consolidation phase. A detailed examination of the underlying market structure reveals several key observations:
- Trend Context: Over recent months, the Brent contract has entered a highly volatile price regime. Nevertheless, from a structural standpoint, the asset continues to trade above its 50-day, 100-day, and 200-day Simple Moving Averages (SMAs), suggesting that the primary bullish bias remains intact. In the short term, price action is testing a descending trendline that marks a significant resistance level. This area could serve as a prominent technical ceiling or, if breached to the upside, a zone for potential further advances.
- Resistance Levels: Should buyers break above immediate resistance at $102.00 (the descending trendline zone), the next major technical ceiling lies at $112.00—a level that converges with the Volume Profile’s Value Area High (VAH). A decisive upside breach of these levels would increase the probability of trading at higher valuations, notably toward the $118.00 resistance level.
- Support Levels: In the event of a price retracement, the primary downside floors are situated at $95.55 and $87.00 per barrel, representing the Volume Profile’s Point of Control (POC) and a key structural support zone, respectively. A decisive breakdown below these levels would materially increase the likelihood of a deeper market contraction.
- Momentum Indicators: The Moving Average Convergence Divergence (MACD) indicator is signalling an upward trajectory, signalling that short-term bullish momentum could persist. Conversely, the Relative Strength Index (RSI) is approaching overbought territory, suggesting caution regarding the short-term impulse. Nevertheless, geopolitical catalysts and underlying supply fundamentals are expected to remain the primary drivers shaping near-term price action.
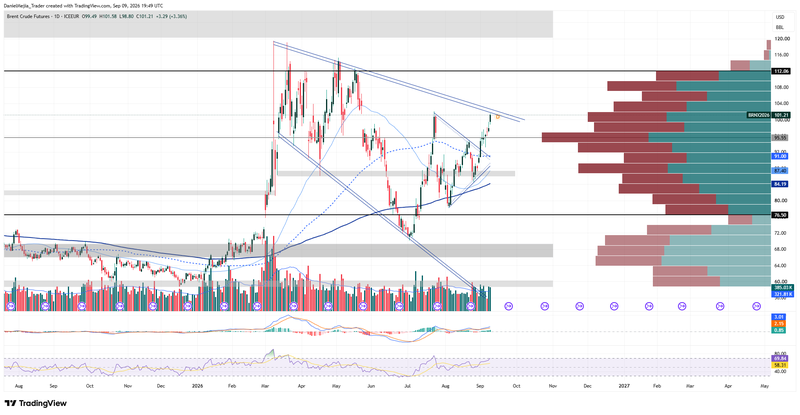
Figure 1: Brent Futures Contract (2025–2026). Source: Data from ICE Futures Europe; author's analysis conducted via TradingView.


