Help
Help Dollar slips after softer inflation data, though hawkish Fed expectations persist
The dollar index weakened after softer-than-expected US inflation reduced expectations of near-term Federal Reserve tightening. However, persistent geopolitical risks and expectations of at least one future interest rate increase continued to support the greenback against major currencies.

US inflation slowed to 3.5% in June, below the 3.8% forecast, while core inflation eased to 2.6%.
The implied probability of a September Fed rate hike fell to 50%, down from above 70%, reducing pressure for immediate tightening.
The DXY slipped by 0.32% to 100.93 but remained above key support, as investors continued to expect future Fed rate increases.
Geopolitical tensions and the risk of higher oil prices could sustain inflationary pressures and keep the Fed relatively hawkish.
US inflation decelerates more than expected
According to data released by the US Bureau of Labor Statistics (BLS), the annual headline inflation rate decelerated from 4.2% in May to 3.5% in June, coming in below market expectations of 3.8%. Meanwhile, annual core inflation—which excludes the more volatile components of energy and food—eased from 2.9% to 2.6% over the same period, reinforcing indications that underlying price pressures moderated during June.
Consequently, market expectations regarding future monetary policy shifted towards a less restrictive outlook. According to the CME FedWatch Tool, market-implied probabilities indicate that a 25-basis-point interest rate increase at the Federal Reserve’s September meeting remains the most likely scenario, with a probability of 50%. However, this represents a notable decline from levels above 70% recorded only a few days earlier. Meanwhile, investors continue to expect the Federal Reserve to leave interest rates unchanged at its July meeting.
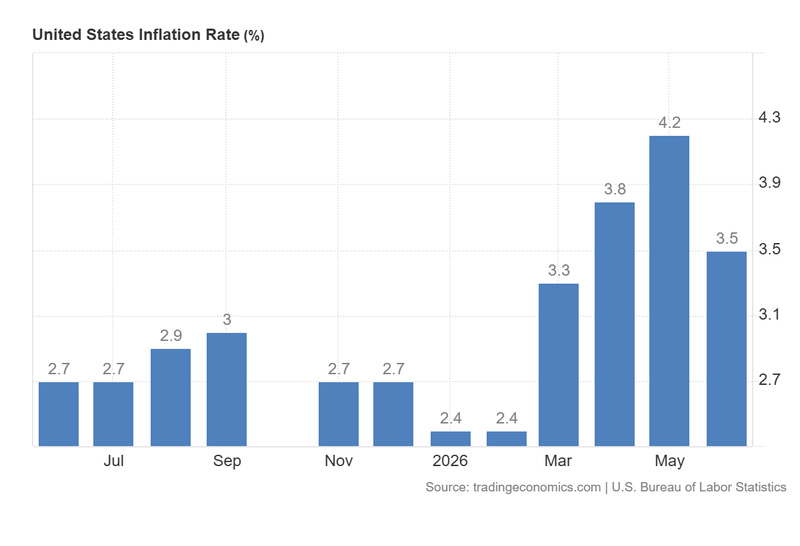
Figure 1. US Inflation Rate (2025–2026). Source: Data from the US Bureau of Labor Statistics; figure obtained from Trading Economics.
Dollar index declines but holds above key support zone
As expectations of a more aggressive Federal Reserve stance eased following the inflation release, the US Dollar Index (DXY)—which measures the greenback against a basket of major currencies, including the euro, Japanese yen, and British pound—fell by 0.32% to 100.93 points.
Nevertheless, the index remains above an important short-term support level, suggesting that underlying demand for the US dollar remains intact. This resilience may be explained by continued expectations that the Federal Reserve could still implement at least one interest rate increase later this year. Higher interest rates tend to support the dollar by increasing the attractiveness of US dollar-denominated assets, particularly Treasury securities, to global investors.
Market participants are also closely monitoring developments in the ongoing US–Iran conflict in the Middle East. Rising geopolitical tensions have contributed to higher oil prices, which could generate additional inflationary pressures and complicate the Federal Reserve’s path towards price stability. Consequently, although the latest inflation data have reduced expectations of near-term monetary tightening, investors remain cautious that energy-driven inflation could encourage the Fed to maintain a relatively hawkish stance in the months ahead.
Technical analysis of the Dollar Index (DXY)
From a technical perspective, the Dollar Index remains positioned within a primary bullish trajectory. Relevant factors are highlighted in the following points:
- Trend context: Over the medium term, the index continues to trade within a descending channel pattern. Nevertheless, the recent rally has propelled the DXY above its 50-day, 100-day, and 200-day Simple Moving Averages (SMAs), suggesting an upward recovery. The index is currently trading above a key structural resistance zone, indicating potential bullish momentum.
- Resistance levels: To the upside, the 101.70 level represents a significant technical hurdle. A decisive breakout above this zone would shift the market’s focus towards the 104.00 level. A sustained move above 104.00 would signal a major transition into a higher and more aggressive trading range.
- Support levels: On the downside, relevant structural support is identified at 100.60. Should this floor be breached, the next critical area of interest would be 99.00, a level that converges with the 200-day SMA. A failure to hold the 99.00 level would likely facilitate a deeper bearish correction.
- Momentum indicators: Both the Moving Average Convergence Divergence (MACD) and the Relative Strength Index (RSI) are trending upwards, indicating strengthening short-term bullish pressure. However, as both indicators approach overbought territory, macroeconomic fundamentals will be pivotal in determining the sustainability of further technical gains.
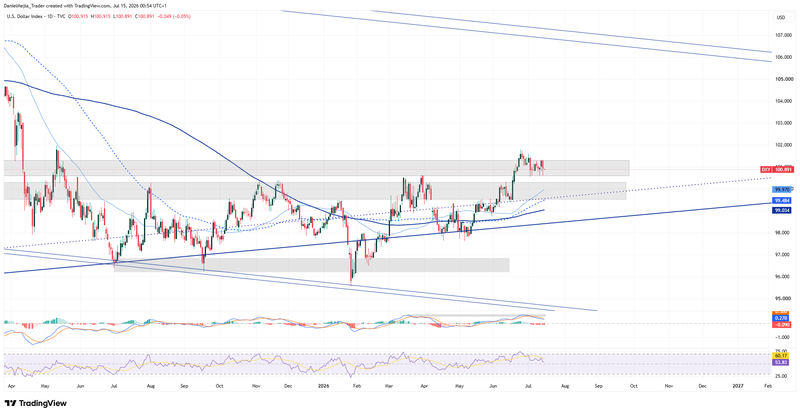
Figure 2. Dollar Index DXY (2025–2026). Source: Data from the Intercontinental Exchange (ICE); own analysis conducted via TradingView.