
 Help
Help Dow Jones edges lower despite easing US inflation
US headline inflation eased to 3.4% in July, lowering September rate hike expectations. Despite moderating prices, the Dow Jones dropped slightly, constrained by ongoing Middle East geopolitical risks and key technical resistance.
US Headline CPI slowed to 3.4% YoY in July, driven by lower gasoline prices, matching forecasts.
Rate hike odds for September fell to 40%, with most expecting the Fed to keep rates at 3.75%.
Strait of Hormuz and Bab el-Mandeb disruptions threaten energy flows and raise inflation risks.
Date: 12 August 2026
Dow Jones falls slightly despite signs of moderating US inflation
According to data released by the US Bureau of Labor Statistics (BLS), the year-on-year (YoY) headline inflation rate decelerated slightly from 3.5% in June to 3.4% in July, matching analysts’ expectations. This deceleration was primarily driven by an easing in gasoline prices, which moderated from 26.7% to 24.6% YoY over the period.
In this context, data from the CME FedWatch Tool indicates that the market-implied probability of a Federal Reserve interest rate hike at its September meeting fell to 40%, down from over 50% in previous days. Conversely, market consensus now assigns a 60% likelihood to the US central bank maintaining its benchmark interest rate at the 3.75% level.
This shift in market expectations occurred amid moderating inflationary pressures and a weak employment report released earlier in the month. Market focus is now turning toward geopolitical factors, as ongoing instability in the Middle East takes precedence. While the Strait of Hormuz remains partially blocked by Iranian looking for its demands are met, maritime traffic through the Bab el-Mandeb Strait has declined amid escalating tensions between Saudi Arabia and Houthi forces. Should both critical maritime corridors remain constrained, severe energy supply chain disruptions could reignite global inflationary pressures.
Following the economic release, the Dow Jones Industrial Average declined marginally by 0.04% to 53,775 points, diverging from the S&P 500 and Nasdaq 100 indices, which both advanced. This divergence reflects underlying consensus uncertainty ahead of the Fed’s forthcoming monetary policy decisions, as the Dow Jones index encounters resistance at the upper boundary of a bullish channel pattern.
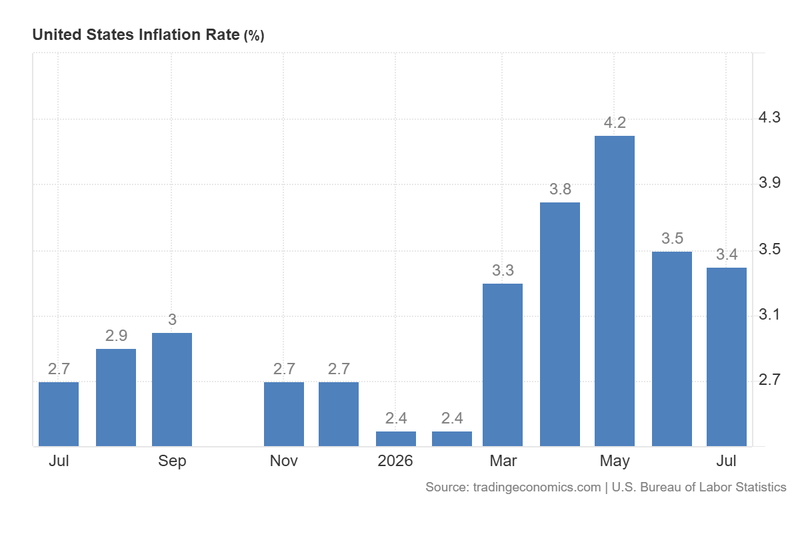
Figure 1. US Inflation Rate (2025–2026). Source: Data from the US Bureau of Labor Statistics; Figure obtained from Trading Economics.
Technical analysis of the Dow Jones index
From a technical standpoint, the Dow Jones continues to operate within a long-term bullish framework. A detailed examination of the current chart structure highlights several key technical considerations:
- Trend Context: Over the long term, the index maintains a classic bullish market structure defined by a sequence of higher highs and higher lows. Crucially, price action remains comfortably above its 50-day, 100-day, and 200-day Simple Moving Averages (SMAs), confirming that the upward trend remains intact.
- Resistance Levels: Should upside momentum persist, the immediate resistance level is the historical record high of 54,350. Beyond that, the next psychological ceiling is positioned at 55,000. A sustained breakout above this level would confirm the continuation of the broader bull market into uncharted territory.
- Support Levels: On the downside, immediate support is located at 53,642. A failure to hold above this level would bring the critical 51,700 support zone into play. A breakdown below the 51,700 support zone would increase the likelihood of a deeper market correction.
- Momentum Indicators: Both the Moving Average Convergence Divergence (MACD) and the Relative Strength Index (RSI) are hovering near overbought territory. Notably, the MACD exhibits a bearish divergence, suggesting that a short-term pullback or period of consolidation could occur. However, near-term price direction will likely continue to be driven by fundamental and geopolitical developments.
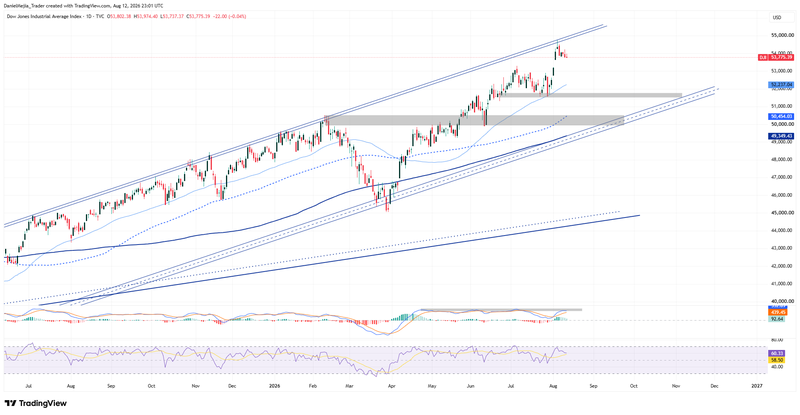
Figure 2. Dow Jones Index (2025–2026). Source: Own analysis conducted via TradingView.


