Dow Jones hits record high on optimism over US–Iran peace deal
The Dow Jones reached a record high as optimism surrounding a preliminary US–Iran peace deal improved risk sentiment and reduced market volatility. Lower expectations of Federal Reserve rate hikes provided additional support.

The Dow Jones rose by 0.92% to a record 51,676, as hopes for a US–Iran peace deal boosted risk appetite and eased concerns over energy supply.
Markets priced in lower Federal Reserve tightening risk: the implied probability of an October rate hike fell to 31.9%, while that of a December increase edged down to 41.9%.
The VIX fell by 8.26% to 16.21, signalling calmer sentiment as investors welcomed the possibility of a 60-day ceasefire extension.
From a technical perspective, the uptrend remains intact, although an overbought RSI and bearish MACD divergence point to the risk of a pullback.
Dow Jones reaches a fresh record amid optimism over a US–Iran agreement
The peace agreement announced over the weekend between the United States and Iran triggered strong reactions across several financial markets, including US equities, which advanced firmly amid rising hopes that energy supply conditions through the Strait of Hormuz could normalise.
According to Reuters, US President Donald Trump stated that a preliminary agreement to end the Gulf conflict had already been signed by the United States and Iran, although no details had yet been disclosed. Government spokesmen from both countries suggested that the official agreement would be signed at a ceremony in Geneva next Friday. Meanwhile, it is understood that the agreement would reopen the Strait of Hormuz and extend the ceasefire for 60 days, although important issues would remain unresolved, including Iran’s nuclear programme and the final status of the conflict in Lebanese territory.
In addition, according to CME’s FedWatch Tool, market-implied probabilities now suggest a greater likelihood that the US central bank may keep interest rates unchanged at current levels over the coming months in 2026. The implied probability of an interest rate hike at the October meeting declined to 31.9%, while the implied probability of a rate increase in December fell to 41.9%, slightly below the 42.1% probability associated with no rate cut. Market participants are now focused on the current week, as the Federal Reserve is due to announce its monetary policy decision, with the new Chairman, Kevin Warsh, presiding over the institution.
Against this backdrop, expectations drove the Dow Jones Industrial Average to a fresh record high, rising by 0.92% to 51,676 points. By contrast, the volatility index (VIX) fell sharply by 8.26%, closing at 16.21 points at the market close.
Technical analysis of the Dow Jones index
From a technical perspective, the Dow Jones continues to move within a well-defined long-term bullish framework. A detailed assessment of the current chart structure yields several key observations:
- Trend context: Over a multi-month horizon, the index maintains a classic market structure defined by a sequence of higher highs and higher lows. Crucially, it continues to trade comfortably above its 50-day, 100-day, and 200-day Simple Moving Averages (SMAs), confirming that the primary trend remains structurally intact. However, short-term oscillators indicate that the market has moved deep into overextended territory.
- Resistance levels: Should the index achieve a decisive upside breakout above the psychological barrier of 52,000 points, the next relevant resistance level would be 53,500 points, corresponding to the upper boundary of the bullish channel pattern. A sustained close above this ceiling would signal a formal continuation of the secular bull market into uncharted territory.
- Support levels: On the downside, immediate structural support is identified at the 50,500 level. A failure to maintain this floor would bring the key 48,000 support zone into focus, which aligns with the lower boundary of the ascending trendline within the bullish channel pattern and the 200-day SMA. A breach of this 48,000 pivot would significantly increase the probability of a deeper structural correction.
- Momentum indicators: Both the Moving Average Convergence Divergence (MACD) and the Relative Strength Index (RSI) are currently in overbought territory, while the MACD is exhibiting a form of bearish divergence. These elevated readings suggest that immediate upward momentum may be becoming exhausted, increasing the likelihood of a short-term technical retracement or a temporary consolidation phase.
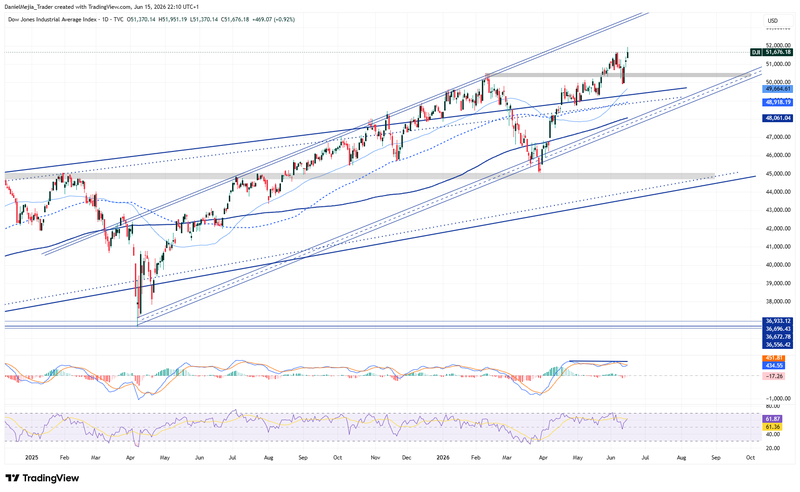
Figure 1. Dow Jones Index (2025–2026). Source: Own analysis conducted via TradingView.


