
 Help
Help FTSE 100 advances on strong UK retail sales data
The FTSE 100 rose 0.91% to close at 10,736 following a significant 4.2% year-on-year surge in UK retail sales. Easing inflationary pressures alongside resilient consumer demand continue to underpin market expansion, with underlying technical indicators maintaining a robust long-term bullish posture.

UK retail sales jumped 4.2% year-on-year in June, substantially outperforming consensus forecasts of 2.3% and bolstering market sentiment.
Robust consumer spending paired with moderating inflation reduces immediate policy pressure on the Bank of England, creating a supportive backdrop for corporate capital expenditure.
The FTSE 100 remains firmly entrenched in a long-term bullish trend, trading comfortably above its primary moving average thresholds.
Date: 24 July 2026
FTSE 100 gains as robust retail sales boost UK market sentiment
The UK FTSE 100 index advanced by 0.91% to settle at 10,736, marking its highest level since early March. This upward momentum was driven by stronger-than-expected retail sales data across the United Kingdom, which soundly beat analyst projections.
According to figures released by the Office for National Statistics (ONS), year-on-year retail sales accelerated from 3.5% in May to 4.2% in June, vastly exceeding market expectations of a 2.3% increase. On a month-on-month basis, retail sales volume rose by 1.0%, defying consensus estimates that anticipated a 0.3% contraction. The latest data underscores the underlying resilience of aggregate consumption in the UK, reflecting a sustained acceleration over the past two months.
Why does the FTSE 100 increase amid solid retail sales?
Resilient retail demand, stable labour market conditions, and the recent deceleration in consumer price inflation collectively diminish the necessity for the Bank of England (BoE) to adopt a more restrictive monetary stance amidst global geopolitical headwinds. UK equities generally benefit from an environment of lower—or at least stable—benchmark interest rates, as manageable borrowing costs allow listed corporations to execute expansionary capital projects without encountering elevated financing expenses.
Furthermore, a stable interest rate environment mitigates valuation compression, as lower implied discount rates prevent adverse adjustments to the present value of anticipated future cash flows of firms.
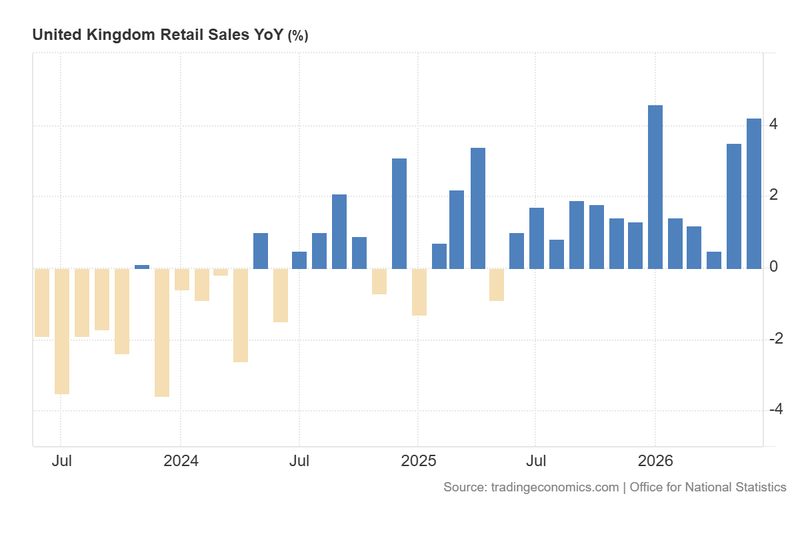
Figure 1. United Kingdom Retail Sales (2023–2026). Source: Data from the Office for National Statistics; figure obtained from Trading Economics.
Technical analysis of the FTSE 100 index
From a technical perspective, the FTSE 100 index retains a structurally sound, long-term bullish trajectory.
- Trend Context: Over a macro horizon, the FTSE 100 displays a classic ascending market structure defined by a sequential pattern of higher highs and higher lows. The index continues to trade comfortably above its 50-day, 100-day, and 200-day Simple Moving Averages (SMAs), confirming the integrity of the broader uptrend.
- Resistance Levels: Should the index breach its historical peak near 10,900 points, the next primary technical ceiling is situated at the psychological 11,500 level. A decisive breakout above these boundaries would mark an entry into price discovery across uncharted territory.
- Support Levels: In the event of a short-term pullback below the 10,500 support region, the primary structural floor sits at 10,100 points—a zone that coincides with the 200-day SMA. A sustained breakdown beneath 10,100 would materially increase the probability of a broader market correction.
- Momentum Indicators: Both the Moving Average Convergence Divergence (MACD) and the Relative Strength Index (RSI) reflect neutral readings, pointing to a temporary consolidation phase. This technical behaviour is consistent with the formation of a five-month ascending triangle pattern.
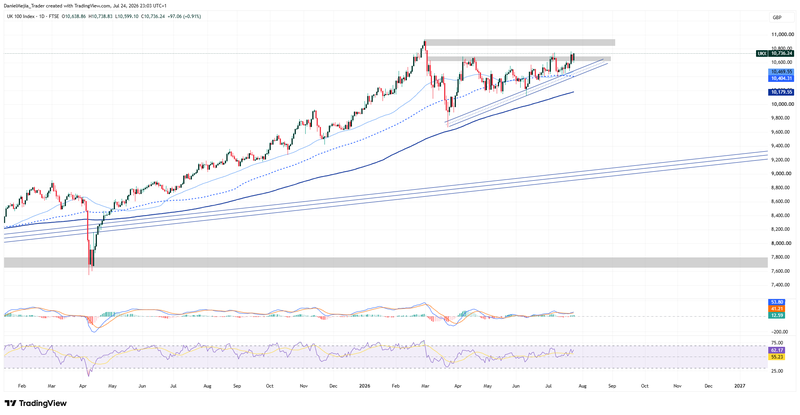
Figure 2. FTSE Index (2025–2026). Source: Own analysis conducted via TradingView.


