
 Help
Help Gold climbs firmly on weak US NFP data, breaching a key technical barrier
Gold surged 2.33% to $4,399 per ounce as weak US labour market data dampened expectations of a hawkish Federal Reserve monetary stance. A softer US dollar and ongoing geopolitical risks further reinforced the precious metal's safe-haven appeal.

US Non-Farm Payrolls (NFP) contracted by 23,000 in July, reducing the market-implied probability of a 25-basis-point Fed rate hike from 54% to 44%.
The US Dollar Index (DXY) fell 0.36% to 99.60 points, enhancing gold's affordability for international buyers.
Gold maintains a robust bullish structure, breaching a short-term downward trendline while MACD and RSI indicators signal expanding upward momentum.
Date: 7 August 2026
Gold surges above key resistance after soft US non-farm payrolls report
The gold futures contract (GCZ6) appreciated by 2.33% to trade at $4,399 per ounce, driven by diminished expectations of a hawkish Federal Reserve (Fed) stance ahead of its next interest rate decision, alongside a depreciation in the US dollar index.
According to data released by the US Bureau of Labour Statistics (BLS), Non-Farm Payrolls (NFP) contracted by 23,000 in July—a sharp downside surprise compared to the consensus expectation of 80,000 new jobs. Consequently, the CME FedWatch Tool indicated that the implied market probability of a 25-basis-point interest rate increase fell from 54% to approximately 44%. Currently, FedWatch probabilities signal a 56% likelihood that the Federal Reserve will maintain benchmark interest rates unchanged at the current level of 3.75% during its September meeting.
In this economic environment, bullion typically benefits as yields on US government bonds become less attractive, leading investors to seek refuge in gold amid broader geopolitical instability. Concurrently, a weaker US dollar against major currencies makes the precious metal more competitive for international buyers. At the market close, the US Dollar Index (DXY) depreciated by 0.36% to 99.60 points on expectations of a more neutral Fed policy path.
Technical analysis of Gold
From a technical perspective, gold futures continue to maintain a robust long-term bullish trajectory. A detailed analysis of the current market structure reveals several key observations:
- Trend Context: On daily timeframes, gold exhibits a clear bullish market structure defined by a sequence of higher highs and higher lows. In the short term, the price action has breached a downward trendline, suggesting a potential continuation of the recovery.
- Resistance Levels: Should the 200-period Simple Moving Average (SMA) at $4,500 be breached to the upside, the next significant technical ceiling is identified at $4,870—a key short-term resistance level. A sustained close above this threshold would signal the potential for further extension into higher valuation territory.
- Support Levels: In the event of a market retracement, immediate short-term support is located at the $4,000 level, representing a prominent structural floor and a psychological barrier. If this zone is invalidated, the next critical floor lies at $3,700. A break below these zones would notably increase the probability of a broader market correction.
- Momentum indicators: The Moving Average Convergence Divergence (MACD) indicator exhibits a bullish divergence and is trending upwards, reflecting a strengthening in bullish momentum. Meanwhile, the Relative Strength Index (RSI) demonstrates rising momentum, suggesting that price strength could persist in the short term, though it is approaching overbought territory.
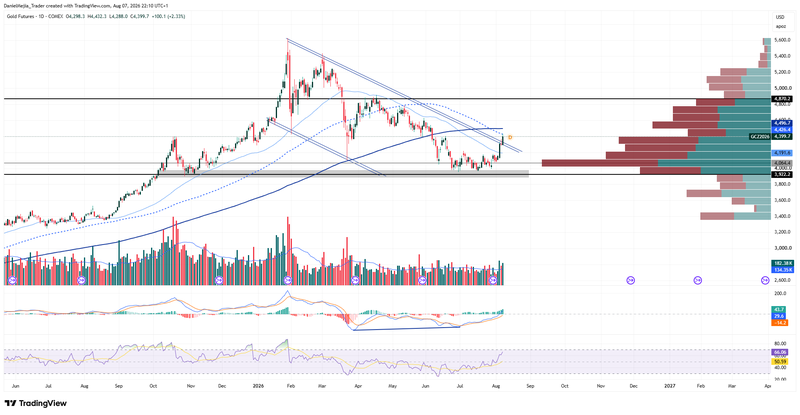
Figure 1. Gold Futures Contract (2025–2026). Source: Data from the COMEX Exchange; own analysis conducted via TradingView.


