
 Help
Help Gold falls as expectations of a more restrictive Fed policy rise
Gold dropped 3.56% to $4,167 per ounce as rising expectations of hawkish central bank policies globally, higher bond yields, and a stronger US dollar drive capital towards yield-bearing assets.

The CME FedWatch Tool indicates a 70% probability of a 25-basis-point rate hike from the Federal Reserve in October.
Rising global bond yields and a stronger US Dollar Index (DXY) reduce the appeal of non-yielding bullion.
Despite short-term selling pressure, global gold ETFs added $18 billion in August, driven by safe-haven demand.
Date: 29 September 2026
Why is gold declining amid growing expectations of a more hawkish stance from major central banks?
Gold futures contracts (GCZ6) fell by 3.56% to $4,167 as persistent global inflationary pressures drive central banks towards tighter monetary policy. Bullion typically trades lower in a high-interest-rate environment, as government bonds become increasingly attractive relative to non-yielding assets such as gold. This dynamic triggers capital reallocation towards sovereign bond markets as investors seek superior risk-adjusted return profiles.
In the United States, market sentiment points towards a further hawkish monetary policy stance from the Federal Reserve amid persistent inflationary pressures. According to the CME FedWatch Tool, the market-implied probability reflects a 70% likelihood that the Fed will raise its benchmark interest rate by 25 basis points to 4.25% at its October meeting. Furthermore, market pricing indicates a 58% probability of a second interest rate increase at the FOMC's December meeting.
This shift is particularly significant because these hawkish expectations have driven the US Dollar Index (DXY) higher, making bullion more expensive for international buyers given that gold is denominated in US dollars. Over the past month, the DXY has appreciated by approximately 1.45% on the back of hawkish expectations surrounding upcoming Federal Reserve policy decisions.
Concurrently, the European Central Bank (ECB) and the Bank of Japan (BoJ) have adopted tighter policy stances, both having raised benchmark interest rates at their most recent monetary policy meetings. Against this backdrop, market participants expect that the Bank of England (BoE) and the Reserve Bank of Australia (RBA) could also implement interest rate hikes at their upcoming policy meetings.
This prospective tightening threatens to exert further downward pressure on gold amid heightened yield competition across global debt markets. Notably, long-term government bond yields across US, European, and Japanese sovereign bond markets have reached multi-decade highs, reflecting investor positioning for sustained restrictive policies from Western central banks.
Is gold losing its attractiveness for institutional investors?
However, despite gold prices experiencing sharp selling pressure, global inflows into Gold Exchange-Traded Funds (ETFs) have exhibited strong resilience in recent months. According to a report from the World Gold Council, global investors expanded their gold ETF allocations by approximately $18 billion in August 2026 alone—marking the second-largest monthly inflow in roughly three years. This trend highlights sustained institutional demand for bullion as a strategic portfolio allocation and a hedge against elevated geopolitical and macroeconomic instability worldwide.
Technical analysis of gold
From a technical perspective, gold futures maintain a robust long-term bullish trajectory; however, bullion is experiencing pronounced short-term selling pressure. A detailed analysis of the current market structure reveals several key technical dynamics:
- Trend context: On the long-term, gold exhibits a broader bullish structure characterised by a sequence of higher highs and higher lows. However, prices have fallen below the 50-day, 100-day, and 200-day Simple Moving Averages (SMAs), signalling intensifying bearish momentum. Furthermore, on the short-term performance, bullion breached the 61.8% Fibonacci retracement level of the preceding bullish move, suggesting potential downside exposure towards longer-term technical support floors.
- Resistance levels: Should bullish momentum re-emerge, the primary technical resistance levels stand at $4,430 and $4,720. A sustained daily close above these thresholds could signal scope for renewed upside expansion.
- Support levels: If selling pressure persists, immediate short-term support lies at $4,064—a key technical zone aligned with the Volume Profile's Point of Control (POC). Should this level fail to hold, the primary structural floor sits at $3,922, representing a prominent structural long-term support. A decisive breakdown below these levels would increase the probability of a deeper market correction.
- Momentum and volume: Both the Moving Average Convergence Divergence (MACD) and the Relative Strength Index (RSI) are trending downwards, indicating that short-term bearish momentum could persist. However, with the RSI approaching oversold territory, bullion’s price may encounter renewed buying interest near key technical levels.
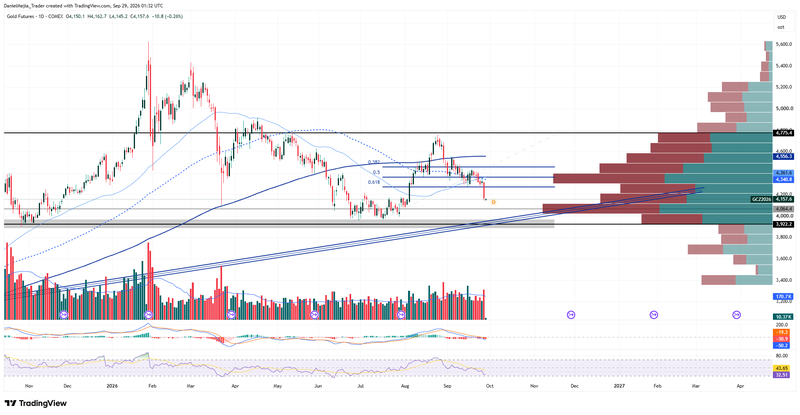
Figure 1. Gold Futures Contract (2025–2026). Source: Data from COMEX Exchange; author's analysis conducted via TradingView.


