Help
Gold falls below the $3,700 mark as strong US dollar and Treasury yields weigh
Gold futures dropped below $3,700, down 33% from January's peak, as a surging US dollar, elevated 10-year Treasury yields, hawkish Federal Reserve expectations, and easing geopolitical tensions weighed heavily.

The US Dollar Index has risen by 5.5% year-to-date (YTD), making gold costlier for holders of foreign currencies.
US 10-year Treasury yields have reached 5.05%, increasing the opportunity cost of holding gold.
Markets are pricing in a 97% probability of a December rate hike to curb inflation in the US.
Diplomatic progress between the US and Iran, as well as Russia and Ukraine, may be reducing safe-haven demand.
Date: 20 November 2026 (GMT+3)
Why has gold fallen below $3,700?
Gold prices have experienced significant selling pressure in recent periods. The gold futures contract (GC) has accumulated a decline of approximately 6.5% over the past five days, currently trading at $3,623 at market close. Notably, on a year-to-date (YTD) basis, the price has fallen by approximately 16%, signalling a deterioration in the broader market trend. From its January 2026 peak of $5,416, bullion has recorded a relative drawdown of 33%.
This underlying weakness in bullion has been driven primarily by a stronger US dollar and elevated Treasury yields, both of which tend to weigh on gold prices. Higher yields increase the opportunity cost of holding non-yielding assets such as gold, whilst a stronger dollar makes bullion more expensive for holders of other currencies.
Against this backdrop, the US Dollar Index (DXY)—which tracks the greenback's performance against a basket of major currencies including the euro, British pound, and Japanese yen—has gained 0.50% over the past five sessions and approximately 5.5% YTD. Meanwhile, the 10-year US Treasury yield has risen by around 86 basis points YTD, reaching 5.05%—an elevated level in the context of the past 20 years.
This strong performance in both the US dollar and Treasury yields has been fuelled by mounting expectations that the Federal Reserve will adopt a more restrictive monetary policy stance to contain inflationary pressures. According to the CME FedWatch Tool, market-implied probabilities signal a 97% likelihood that the US central bank will raise its benchmark interest rate by 25 basis points at its December meeting, followed by a 71% probability of a second 25-basis-point hike at its January 2027 meeting.
Additionally, geopolitical tensions involving both the US and Iran, as well as Russia and Ukraine, have eased amid growing hopes for diplomatic talks. Gold typically performs well during periods of geopolitical friction owing to its status as a safe-haven asset; accordingly, reduced exposure by market participants amid diminishing geopolitical uncertainty may be weighing on demand for the precious metal.
Technical analysis of gold
From a technical perspective, gold futures have maintained a downward trajectory over recent months. A structural analysis of current market conditions highlights the following key dynamics:
- Trend Context: On the daily timeframe, gold exhibits a descending trajectory following a bearish breakdown below a long-term ascending trendline that converges with structural long-term support. Furthermore, bullion has faced pronounced selling pressure recently, driving the price below its 50-day, 100-day, and 200-day Simple Moving Averages (SMAs), thereby reinforcing the bearish bias.
- Momentum Indicators: The Moving Average Convergence Divergence (MACD) is trending downwards whilst the negative histogram continues to expand, signalling that selling pressure may persist in the short term. However, the Relative Strength Index (RSI) is trading in oversold territory, suggesting caution regarding the sustainability of bearish momentum and pointing to a potential price recovery or consolidation phase in the short-term.
- Resistance Levels: Should bullish momentum regain strength, the immediate technical ceiling is identified at $3,922—a level where the Volume Profile's Value Area Low (VAL) converges with structural resistance. Beyond this mark, a secondary resistance lies at the $4,000 threshold, a prominent psychological barrier that aligns with the Volume Profile's Point of Control (POC).
- Support Levels: Should selling pressure intensify, primary structural support remains at $3,500 (a significant psychological barrier). A decisive breakdown below this level would expose the next key support zone at $3,400, an area corresponding to a High Volume Node (HVN).
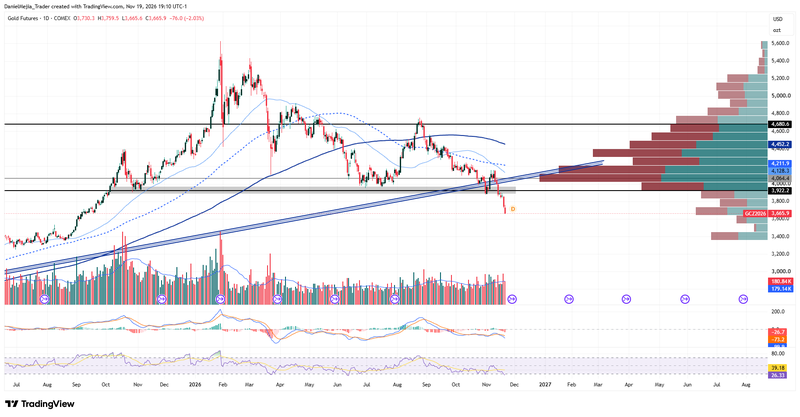
Figure 1. Gold Futures Contract (2025–2026). Source: Data from COMEX Exchange; author's analysis via TradingView.