Help
Help Gold increases on US-Iran peace deal hopes and test a key support area
Gold futures rose by 1.88%, driven by optimism surrounding a potential 60-day US-Iran ceasefire and a weakening US dollar. Despite US Personal Consumption Expenditures (PCE) inflation accelerating to 3.8%, the fact that the data matched market expectations, combined with the prospect of Middle Eastern peace, softened projections for aggressive Federal Reserve monetary tightening.
A potential 60-day US-Iran ceasefire could stabilise the Middle East, though the final accord remains subject to approval by US President Donald Trump.
The US Dollar Index (DXY) retreated to 98.99 points as the in-line annual PCE inflation print of 3.8% eased market anxieties regarding harsher monetary tightening by the Federal Reserve.
Bullion maintains its primary long-term bullish trend above the 200-day Simple Moving Average (SMA), despite a short-term consolidation phase characterised by a pattern of lower highs.
Gold rises on US-Iran peace deal hopes and DXY depreciation
The gold futures contract (GCQ6) on the COMEX exchange advanced by 1.88%, buoyed by rising expectations of a US-Iran diplomatic breakthrough and a concurrent depreciation of the US Dollar Index (DXY). According to Reuters reports, the United States and Iran have reached a memorandum of understanding that outlines a 60-day ceasefire extension. However, this tentative agreement remains subject to the formal sign-off of US President Donald Trump, leaving the ultimate outcome shrouded in near-term political uncertainty pending the White House's official response.
Concurrently, the US Bureau of Economic Analysis (BEA) released its latest PCE price index report, which revealed that the year-on-year (YoY) headline indicator accelerated to 3.8% in April, up from 3.5% in March. Although this spike underscores persistent inflationary pressures for the Federal Reserve, the macroeconomic print proved slightly softer than the most aggressive forecasts and landed broadly in line with consensus analyst expectations.
Consequently, the DXY depreciated by 0.22% over the course of a highly volatile trading session. The index—which measures the performance of the greenback against a basket of major foreign currencies including the euro, the British pound, and the Japanese yen—fell to 98.99 points. This temporary weakness reflected a shifting market consensus that the Federal Reserve may forgo further restrictive policy measures if geopolitical friction in the Middle East successfully abates.
Bullion traditionally appreciates in a more dovish monetary policy context; as yields on fixed-income assets compress, the opportunity cost of holding non-yielding assets declines, making gold highly attractive to investors seeking real returns above the rate of inflation. Furthermore, a softer dollar makes dollar-denominated bullion more affordable for international purchasers. From a technical perspective, the gold futures contract is currently testing a critical structural support area, which could trigger a decisive reaction in near-term price action.
Technical analysis of Gold
From a technical perspective, gold futures maintain a robust long-term bullish trajectory. A detailed analysis of the current market structure reveals several key observations:
- Trend Context: On daily timeframes, gold exhibits an intact primary bullish market structure defined by a clear sequence of higher highs and higher lows. Price action continues to respect the 200-day Simple Moving Average (SMA), confirming the underlying validity of the structural trend. Over recent months, however, short-term price action has entered a consolidative phase, establishing a series of lower highs that indicates a temporary moderation of upward momentum.
- Resistance Levels: Should immediate short-term resistance at $4,750 be breached decisively to the upside, the next significant technical ceiling is identified at the historical record high of $5,350. A sustained close above this threshold would signal a potential extension of price discovery into uncharted territory.
- Support Levels: In the event of a deeper price contraction, immediate short-term support is located at the psychological $4,500 boundary. If this level is invalidated, the next critical structural floor rests at $4,375. This zone carries significant technical weight, as it represents the confluence of the rising 200-day SMA and the support line of a long-term ascending trendline. A structural breach below $4,375 would notably increase the probability of a broader correction.
- Momentum: Both the Moving Average Convergence Divergence (MACD) and the Relative Strength Index (RSI) are currently tracking within neutral territory, reflecting a lack of predominant directional momentum and confirming the market's immediate phase of consolidation.
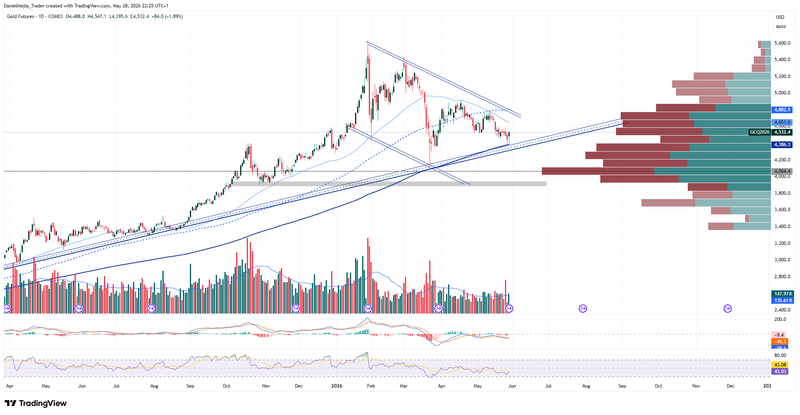
Figure 1. Gold Futures Contract (2025–2026). Source: Data from the COMEX Exchange; own analysis conducted via TradingView.