Help
Help 
Gold near 4,070: correction or Failed Recovery?
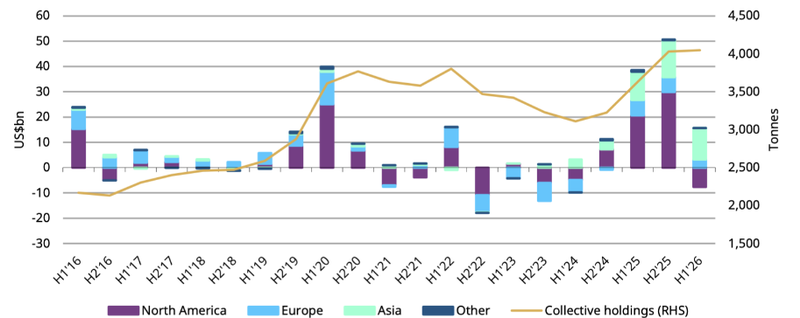
Gold’s rally is no longer being driven by one single force. Central bank demand is still providing a strong floor, while ETF investors are continuing to add exposure even if the pace has cooled from last year’s strongest levels. That combination matters because it shows gold demand is still broad but not overheated in the same way it was during earlier waves of aggressive inflows.
China added 15 tones of gold, its largest reserve increase in two and a half years.
Global gold ETF inflows reached around $8 billion in the first half.
Holding above 4,121–4,129 and reclaiming 4,200 could strengthen the recovery narrative.
China’s gold buying remains an important signal
China’s latest gold reserve increase matters because central bank demand has been one of the most important structural supports for gold in recent years. When the People’s Bank of China adds to its reserves, the market does not treat it as a short-term trading flow. It is usually seen as part of a broader reserve diversification strategy.
That is the key difference
ETF flows can move quickly with real yields, the dollar, and investor positioning. Central bank demand is usually slower, more strategic, and less sensitive to short-term price swings. This is why China’s 15-tonne increase is important. It suggests official-sector demand remains active even after gold’s strong run.
For gold, that helps protect the downside
It does not mean prices can only move higher. But it does mean the market still has a large buyer base that is not purely driven by short-term sentiment. In an environment where governments are still thinking about currency risk, geopolitical risk, and the long-term role of the dollar, gold continues to hold a place in reserve portfolios.
ETF flows are positive, but not as aggressive
The ETF side of the gold story is still supportive, but not as strong as before.
Global gold ETF flows remained positive at around $8 billion in the first half of the year. That tells us investors are still willing to hold gold exposure through listed products, especially while uncertainty around inflation, interest rates, fiscal deficits and geopolitics remains high.
But the pace matters
Although $8 billion is a solid inflow number, it was still the weakest positive first-half flow since H1 2025. That suggests demand has not disappeared, but it is no longer accelerating with the same force. The gold trade still has support, but it may be moving from an aggressive inflow phase into a more selective holding phase.
Source: World Gold Council
Technical outlook
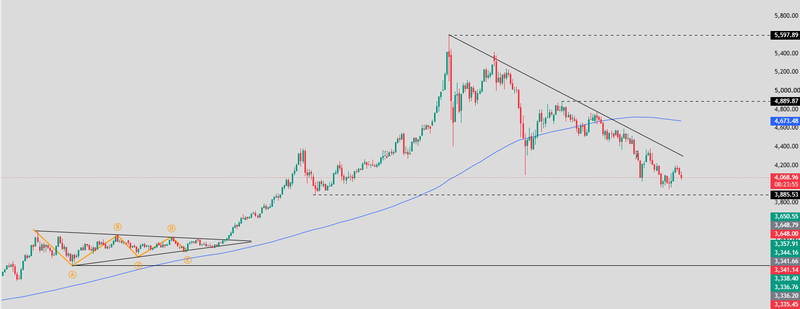
Gold is still trading like a market under pressure. The failed breakout above 5,200 changed the tone, and since then every rebound has run into sellers below the descending trendline. That keeps the chart defensive for now.
The move from the record high near 5,600 has no longer looked like simple profit-taking. It has developed into a broader correction, with lower highs showing that buyers are not yet strong enough to regain control. Softer safe-haven demand has added to the pressure, but the chart tells the more important story: rallies are still being sold.
Price is now around 4,070, sitting not far above the key 3,885 support zone. This area matters because it has stopped deeper declines more than once. If buyers defend it again, gold may be able to build a base and slow the correction. But if 3,885 breaks clearly, the market will likely treat the recent rebound attempts as temporary pauses inside a larger downtrend.
Momentum is also working against gold
Price remains below the 126-day moving average near 4,673, which shows that the medium-term structure is still weak. Short rebounds can happen from oversold areas, but they do not change the broader picture unless gold can reclaim important resistance levels.
The first resistance sits around 4,350–4,400. This is where the descending trendline continues to cap rallies, so it is the first real test for buyers. A move above that area would suggest selling pressure is starting to ease. The bigger level is 4,890, the last important lower high before the recent decline accelerated. If gold can reclaim 4,890, the market would have a stronger reason to believe the correction is turning. Until then, the record high near 5,600 remains too far away to matter in the short term.
Scenarios ahead
The bullish scenario needs gold to hold above 3,885 and then break back above 4,350–4,400. That would show that buyers are defending support and starting to challenge the downtrend. If the move holds, attention could shift toward 4,890, where the next major decision point sits. A clean break above 4,890 would improve the structure and could bring the previous highs back into discussion later.
The weaker scenario begins with a clear break below 3,885. That would confirm that sellers are still in control and could open the way toward 3,650. If that level fails as well, the correction could deepen toward 3,350, where previous consolidation and longer-term support come together. For now, gold is not broken completely, but it still needs to prove that buyers can defend support and stop selling pressure from returning on every bounce.
Source: Trading view