
 Help
Help 
Gold next catalyst may be Washington's bond market playbook
The latest Treasury move is drawing comparisons with one of the most unusual chapters in U.S. financial history. During 1942-1951, Washington kept long-term government bond yields capped at 2.5% to make World War II borrowing more affordable. Today's policy is not a formal yield cap, but the logic looks familiar. Instead of fixing yields outright, the Treasury has doubled its buybacks of 10- to 30-year bonds, trying to ease borrowing costs as federal debt climbs beyond $40 trillion.

The announcement pushed Treasury yields lower and weakened the dollar, giving investors another reason to rebuild positions in gold.
Washington is not formally capping bond yields as it did during 1942-1951 but doubling long-dated Treasury buybacks points.
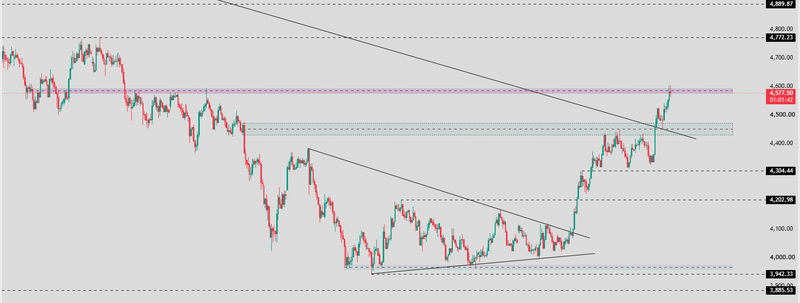
If buyers can hold the price above 4,580-4,600, the recovery could extend toward 4,772.
Gold has been one of the clearest beneficiaries
The announcement pushed Treasury yields lower and weakened the dollar, giving investors another reason to rebuild positions in precious metals. Gold jumped sharply after the buyback expansion, extending a rally that had already been supported by central-bank buying and softer rate expectations.
The historical comparison matters because gold has often performed well when governments step in to influence the bond market. During the 1940s, artificially low yields reduced the real return on government debt and helped create conditions that eventually favored hard assets as inflation accelerated after the war.
Today’s backdrop is different, but market is asking a similar question
Washington is not formally capping bond yields as it did during 1942-1951, but doubling long-dated Treasury buybacks points in the same direction: easing pressure on government borrowing costs as debt climbs above $40 trillion. Investors are starting to ask what happens if interventions become a more regular part of debt management rather than an emergency measure.
That question is helping keep gold in focus. The metal is no longer being bought only as an inflation hedge. It is increasingly attracting investors looking for an asset that sits outside the government's balance sheet at a time when confidence in long-term debt is being tested.
Technical Outlook
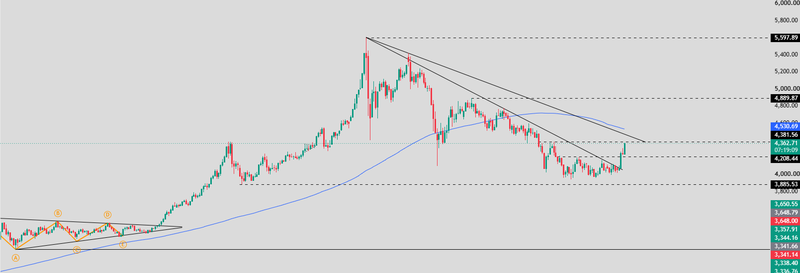
Gold has finally broken out of the downtrend that had been capping every recovery since the fall from 5,600. That changes the tone of the chart. For the first time in weeks, buyers managed to push through a level that repeatedly stopped previous rallies.
Price is now trading around 4,588, leaving 4,208, 4,304 and 4,382 behind. Those levels used to act as resistance. Now they are the first area traders will watch if the market starts pulling back.
What stands out is the timing. Gold has kept climbing even as oil remains near recent highs and the U.S.-Iran peace talks have failed to produce a broader agreement. This time, the move looks broader. Traders are watching Treasury yields and interest-rate expectations just as closely as developments in the Middle East, and that combination has kept buyers active even with tensions still unresolved.
The next obstacle is 4,890. That was the last major turning point before the selloff accelerated, so it is the kind of level where sellers often become active again. A move through it would leave much less resistance before the market starts looking back toward the 5,598-record high, even if that remains a longer-term target rather than the next immediate move.
Source: Trading view
Scenario ahead
Gold has reached an important area after breaking out of the recent downtrend. The next question is whether buyers can hold the market above 4,580-4,600, where selling repeatedly appeared during the correction. If that area starts acting as support instead of resistance, the recovery could extend toward 4,772, with 4,890 becoming the next major level on the chart.
A pause would not be surprising after such a strong move. If gold slips back below 4,600, traders will likely look at 4,382 first. That level was resistance before the breakout, and it is now the first place where buyers have a chance to prove the move still has strength behind it.
The bigger warning sign sits lower. A move back below 4,304 would suggest buyers are losing control and could open the door to a broader pullback toward the 4,203-3,942-support area before another attempt higher.
For now, the advantage has shifted toward buyers, but the market is entering one of the strongest resistance zones of the year. How price behaves around 4,600 is likely to shape the next move more than the breakout itself.
Source: Trading view


