
 Help
Help 
Gold price analysis: can the breakout signal the end of the correction?
Gold is showing its strongest technical improvement in months after breaking above a descending trendline that had capped every recovery attempt since the sell-off from its record high. Buyers have also pushed the market back above an important resistance level, raising hopes that the long correction may finally be losing momentum.

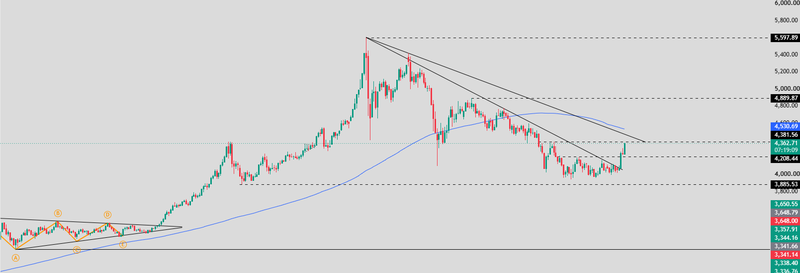
Gold has broken above a key descending trendline and reclaimed the 4,208-resistance level.
The 126-day moving average near 4,530 remains the main barrier to a broader trend reversal.
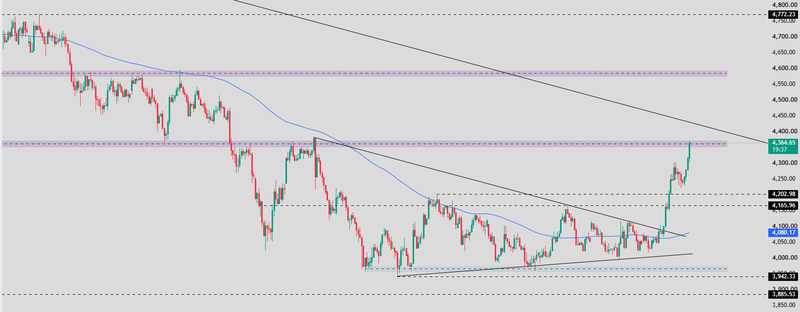
On the 4-hour chart, buyers are testing the important 4,320–4,350 resistance zone.
Daily chart points to improve momentum
The daily timeframe suggests that selling pressure is beginning to ease after several months of lower highs and failed recovery attempts. Since pulling back from the record high near 5,600, gold has traded beneath a well-defined descending trendline, with each rally fading before buyers could regain control.
That pattern has now started to change
The recent breakout above the trendline is the first meaningful technical improvement since the correction began. Buyers have also reclaimed the 4,208-resistance level after repeatedly defending the 3,885–4,000 demand zone, a sign that confidence is gradually returning to the market. Holding above 4,208 would strengthen the view that gold is moving beyond a simple rebound and beginning to build a more durable base.
The 126-day moving average is still the key hurdle
Despite the stronger tone, the broader trend has not yet turned bullish. Gold remains below the 126-day moving average near 4,530, a level that has become the main dividing line between a recovery and a genuine trend reversal.
If price remains beneath that average, sellers still retain the advantage on the higher timeframe. A decisive move above would signal that medium-term momentum is shifting back in favour of buyers and would likely improve confidence across the market.
Above the 126-day moving average, the next important resistance comes in around 4,890, where the previous rally lost momentum before the correction accelerated.
On the downside, 4,208 is now the first level to watch. If buyers can defend it, the recent breakout remains intact. A move back below that level would shift attention toward the 3,885-support area, which continues to represent the most important floor on the daily chart.
Buyers are approaching their first real test on the 4-hour chart
The shorter-term picture has improved even more noticeably. Gold has broken above the descending trendline that had limited every rally since the decline from 4,770. At the same time, prices have climbed back above the 126-period moving average near 4,080, suggesting that short-term momentum has turned in favour of buyers. The latest advance has also carried gold above 4,203, bringing the market into the 4,320–4,350 resistance zone.
This area represents the first significant test of recovery
Previous rallies struggled here, making it a logical area for sellers to defend. A pause or pullback from this zone would not necessarily damage the improving outlook, but it would suggest that buyers are beginning to meet stronger supply after a sharp advance.
Source: Trading view
Technical outlook
The bullish case depends on gold establishing acceptance above the 4,320–4,350 resistance zone. More importantly, price needs to close above 4,380 rather than simply trading through its intraday. A sustained close above that level would strengthen the breakout and shift attention toward 4,772, followed by the larger resistance around 4,890.
If gold briefly trades above 4,380 but fails to close above it, the move could prove to be nothing more than a liquidity grab. That would suggest buyers lacked the conviction to hold the breakout, increasing the risk of profit-taking and another move back into the previous trading range.
If the market fails to clear 4,350–4,380, a period of consolidation would become more likely. Initial support is located around 4,203, while the 4,080 area where the 126-period moving average now sits should provide stronger support if selling pressure increases.
A deeper pullback toward 3,940 would not necessarily change the short-term outlook. If gold continues to build higher lows above that level, the recovery structure would remain intact, with any weakness viewed as consolidation rather than the start of another major decline.
For now, the technical picture is the most constructive it has been for several months. The next move will depend on whether buyers can turn the recent breakout into a sustained close above 4,380, rather than another rally that briefly clears resistance before reversing lower.
Source: Trading view


