
 Help
Help Is capital rotating within US equities? Dow Jones nears record high
Capital is potentially rotating away from technology shares toward defensive equities as mounting concerns over artificial intelligence (AI) capital expenditure weigh heavily on the Nasdaq. Meanwhile, robust corporate earnings from blue-chip components, including The Coca-Cola Company and The Boeing Company, have propelled the Dow Jones Industrial Average toward record highs.

Capital is potentially shifting away from high-valuation technology equities into defensive sectors, driving a 1.03% gain in the Dow Jones.
The Dow Jones is trading near its record high of 53,065 points, underpinned by significant revenue beats among key constituents.
Coca-Cola reached an all-time high following strong quarterly results, while Boeing surged despite missing earnings per share (EPS) forecasts.
Date: 28 July 2026
US equity markets show increasing divergence
Major US stock benchmarks have exhibited a pronounced divergence over recent trading sessions. Since 23 July, the Dow Jones Industrial Average has advanced by 0.55%, whereas the broader S&P 500 index has edged down by 1.05%, and the tech-heavy Nasdaq 100 has fallen sharply by 4.89%. At the market close, the Dow Jones gained 1.03% to settle at 52,752 points, closing in on its record peak of 53,065.
This divergence points to a potential re-allocation of capital away from technology and semiconductor enterprises toward defensive and value-oriented sectors, as well as resilient blue-chip corporations. The shift comes amid growing investor concern that extensive capital expenditure in artificial intelligence may fail to justify the elevated valuations currently assigned to AI-linked tech firms.
Additionally, the Dow Jones benefited from strong financial performance reported by its major constituents, notably The Coca-Cola Company and The Boeing Company, both of which posted firm advances.
The Coca-Cola Company surpassed analyst expectations across both top-line revenue and earnings per share (EPS). Coca-Cola reported total revenue of $13.40 billion, topping the consensus estimate of $13.16 billion. In turn, the beverage giant delivered an EPS of $0.97, beating expectations of $0.93. Consequently, Coca-Cola shares surged 5% to close at a new record high of $88.27.
Meanwhile, aerospace and defence giant The Boeing Company exceeded revenue expectations but missed on EPS projections. The firm generated $24.60 billion in revenue against a forecast of $23.95 billion. Conversely, Boeing reported a quarterly EPS contraction of $0.76—a steeper decline than the expected $0.29 loss. Nevertheless, Boeing's shares advanced 4.76% to close at $221.56.
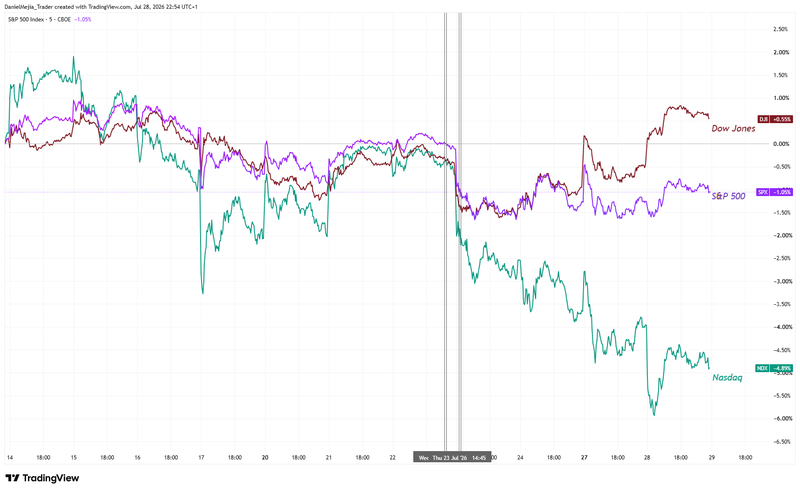
Figure 1. Dow Jones, S&P 500, & Nasdaq 100 (two-week performance). Source: Own analysis conducted via TradingView.
Technical analysis of the Dow Jones index
From a technical standpoint, the Dow Jones continues to operate within a well-established, long-term bullish framework. A detailed examination of the current chart structure highlights several key technical considerations:
- Trend Context: Over the long term, the index maintains a classic bullish market structure defined by a sequence of higher highs and higher lows. Crucially, price action remains comfortably above its 50-day, 100-day, and 200-day Simple Moving Averages (SMAs), confirming that the upward trend remains intact.
- Resistance Levels: Should upside momentum persist, the immediate resistance level is the historical record high of 53,065. Beyond that, the next psychological ceiling is positioned at 54,000. A sustained breakout above this level would formally confirm the continuation of the broader bull market.
- Support Levels: On the downside, immediate support is located at 51,630. A failure to hold above this level would bring the critical 50,500 support zone into play. A breakdown below this 50,500 pivot point would increase the likelihood of a deeper market correction.
- Momentum Indicators: Both the Moving Average Convergence Divergence (MACD) and the Relative Strength Index (RSI) are hovering near overbought territory. Notably, the MACD exhibits a bearish divergence, suggesting that a short-term pullback or period of consolidation could occur. However, near-term price direction will likely continue to be driven by fundamental and geopolitical developments.
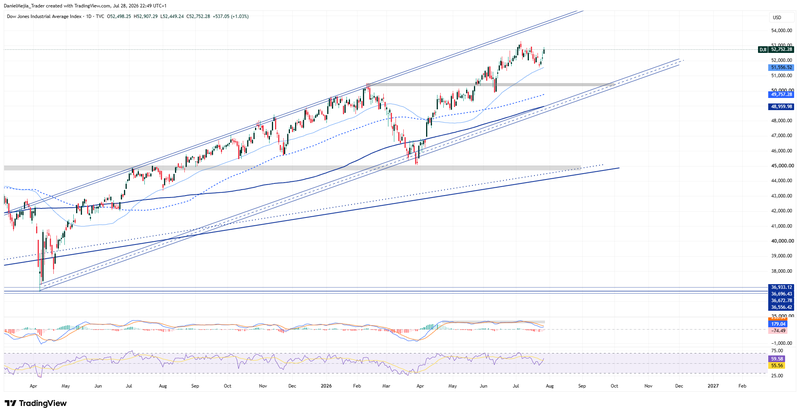
Figure 2. Dow Jones Index (2025–2026). Source: Own analysis conducted via TradingView.


