Help
Help Japan’s bond yields hit the 3% mark, adding to BoJ policy challenges; USD/JPY rises
Japanese 10-year bond yields have hit a 30-year high of 3%, intensifying pressure on the Bank of Japan to hike interest rates despite economic weakness. Meanwhile, the USD/JPY pair maintains bullish momentum.

Japan's 10-year bond yield hits 3%, a 30-year high, reflecting heightened concerns over sovereign debt and inflation.
The BoJ faces mounting pressure to raise rates to curb inflation, despite sluggish GDP growth.
Hawkish pressures build, with analysts anticipating two Bank of Japan interest rate hikes during 2026.
Date: 1 September 2026
What does the rise in Japanese bond yields to 3% mean for the BoJ?
Japanese 10-year government bond yields have reached the 3% threshold, the highest level recorded in 30 years. This reflects sustained selling pressure from bondholders driven by rising concerns over inflation and sovereign debt levels in Japan and exhibiting the inverse relationship between yields and prices. According to the Japanese Ministry of Finance, the government debt-to-GDP ratio reached 249% in 2025, representing one of the highest debt metrics globally.
In this context, the Bank of Japan (BoJ) faces a complex scenario regarding upcoming monetary policy decisions. On the one hand, Japan is highly dependent on crude oil imports; in an environment of a weak Japanese yen, inflation risks being imported through energy acquisitions. Currently, Japanese inflation stands at 1.9%, marking three consecutive months on an upward trajectory. This intensifies pressure on the BoJ to raise interest rates in order to support the domestic currency and contain inflationary risks. Additionally, higher bond yields reflect market participants' growing distrust of the Japanese economy, adding pressure for the Japanese central bank.
On the other hand, the BoJ faces counter-pressures from a domestic economy that has struggled to achieve sustained growth. Over the last four quarters, gross domestic product (GDP) has expanded by an average of just 0.1%, underscoring underlying economic weakness. Nevertheless, hawkish pressures are becoming increasingly evident for the central bank, with analysts forecasting two interest rate hikes during the remainder of 2026.
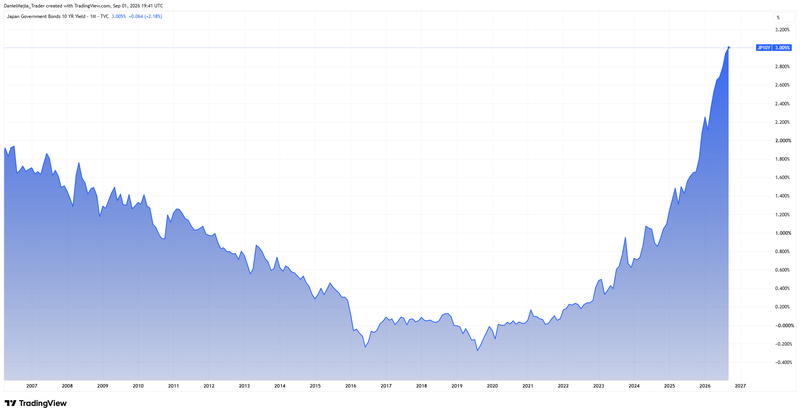
Figure 1. Japan Government Bonds 10-Y (2006–2026). Source: Figure obtained via TradingView.
Technical analysis of the USD/JPY pair
From a technical perspective, the USD/JPY pair is currently exhibiting bullish momentum. Key observations include:
- Trend context: Over the long term, the pair maintains a technically bullish structure, defined by higher highs and higher lows. Furthermore, the pair is trading above its 100-day and 200-day Simple Moving Averages (SMAs), reinforcing this bullish bias.
- Resistance levels: Should short-term bullish momentum persist, the next significant resistance level lies at ¥161.80. A breach above this key technical zone could pave the way for appreciation towards the ceiling at ¥164.00. A decisive break above these levels would signal potential for further expansion into higher price territory.
- Support levels: If short-term support at ¥159.50 is invalidated, the next critical floor is identified at ¥158.50, which is currently situated near the 200-day SMA. A breach of these zones would significantly increase the likelihood of a deeper market correction.
- Momentum indicators: The Moving Average Convergence Divergence (MACD) and the Relative Strength Index (RSI) are signalling upward trajectories, suggesting that bullish momentum could continue. Nevertheless, macroeconomic factors are expected to remain the primary drivers of future market trajectory.
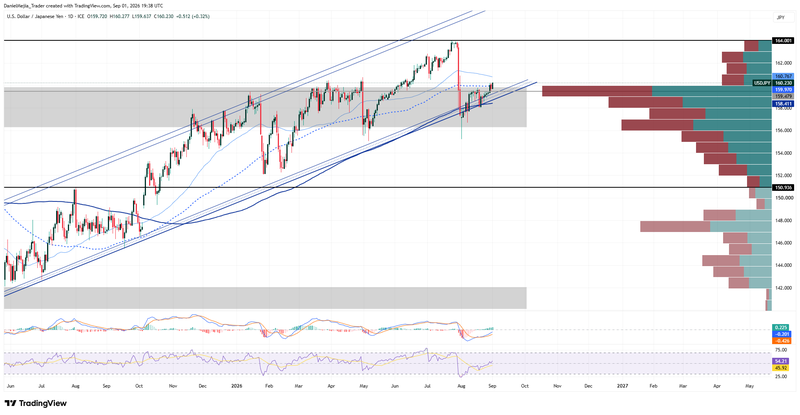
Figure 2. USD/JPY Pair (2025–2026). Source: Data from the Intercontinental Exchange (ICE); own analysis conducted via TradingView.