Nasdaq closes at record high on strong Hewlett Packard results and tech rally
The Nasdaq hit a record high above 30,000, powered by Hewlett Packard's stellar earnings and an expansionary ISM Manufacturing PMI of 54. Heavyweights like Nvidia and Microsoft fuelled the rally.

HPE surged over 9% after beating estimates with $10.7B in revenue (up 39.9% YoY) and an EPS of $0.79, driving strong tech sector momentum.
US ISM Manufacturing PMI hit a 4-year high of 54 in May, driven by strong new orders and production, signalling underlying economic resilience.
Big tech gains supported the rally, with Nvidia jumping 6.26% and Microsoft rising 2.28%, pushing the Nasdaq past the historic 30,000 threshold.
The index trades above key SMAs toward 30,500, but overbought RSI/MACD bearish divergences and geopolitical risks hint at a potential short-term pause.
Nasdaq advances to record high, fuelled by Hewlett Packard earnings and robust ISM manufacturing PMI
The Nasdaq futures contract (NQM6) achieved fresh record highs, underpinned by a highly expansionary US ISM Manufacturing PMI and exceptional financial results from leading technology firms. Most notably, Hewlett Packard Enterprise (HPE) substantially surpassed Wall Street expectations, revealing substantial year-on-year (YoY) growth in both top-line revenue and net profitability.
Hewlett Packard reported total revenue of $10.7 billion, ahead of the market consensus estimate of $9.78 billion. Concurrently, the firm delivered earnings per share (EPS) of $0.79, comfortably beating the $0.53 forecast. These metrics represent a YoY growth rate of 39.9% in aggregate revenue and a 107% surge in EPS. In response, Hewlett Packard’s equity closed the regular session up 9.20%, before rallying an additional 30% in post-market trading immediately following the formal release of the earnings report.
Simultaneously, macroeconomic data provided supplementary tailwinds. According to the Institute for Supply Management (ISM), the US Manufacturing PMI advanced from 52.7 in April to 54.0 in May, exceeding the analyst consensus forecast of 53.0. This reading represents the highest level observed since May 2022 and confirms a sustained economic expansion, remaining well above the neutral 50.0 threshold. The components of the ISM report highlight that the most substantial gains occurred within new orders (rising to 56.8), production volume (reaching 54.3), and order backlogs (accelerating to 52.2). Crucially, the new export orders index also returned to expansionary territory at 50.6. Collectively, the manufacturing data demonstrates robust underlying economic resilience despite prevailing global commercial uncertainties.
These corporate and macroeconomic developments sparked widespread buying across mega cap technology equities. Nvidia and Microsoft shares appreciated by 6.26% and 2.28% respectively, providing the structural weight necessary to lock in the Nasdaq's historic close above 30,000.
Nevertheless, cautious undertones remain. Momentum indicators—specifically the MACD and the Relative Strength Index (RSI)—are displaying bearish divergences, suggesting that the index’s upward velocity could face a temporary slowdown. Furthermore, geopolitical risks regarding the US-Israel-Iran conflict continue to linger; a prolonged escalation of these regional frictions could disrupt market stability and temper equity valuations given the ongoing difficulty in securing a comprehensive peace agreement.
Technical analysis of the Nasdaq Futures Contract
From a technical perspective, the Nasdaq index maintains a structurally long-term bullish trajectory. A granular assessment of the daily charts reveals several key market dynamics:
- Trend Context: In the long term, the Nasdaq exhibits a classic bullish configuration defined by a consistent sequence of higher highs and higher lows. The index continues to trade comfortably above its 50-day, 100-day, and 200-day Simple Moving Averages (SMAs). While the short-term trend remains upwardly aligned, momentum oscillators are heavily extended into overbought territory.
- Resistance Levels: Should the primary bullish trend persist, the next major structural milestone is identified at the 31,000 mark—a significant psychological and technical barrier. A clean breakout above this level would open the door for further price discovery in uncharted territory.
- Support Levels: In the event of a near-term retracement, immediate local support is anchored at 28,800. If this threshold is invalidated, the next critical structural floor resides at 27,300, a level reinforced by its convergence with the ascending 50-day SMA. A decisive breach below 27,300 would significantly increase the probability of a deeper market correction.
- Momentum Indicators: Both the Moving Average Convergence Divergence (MACD) and the Relative Strength Index (RSI) are exhibiting bearish divergences while operating deep within overbought zones. This combination could imply that a brief market consolidation or a technical retracement may occur in the short-term.
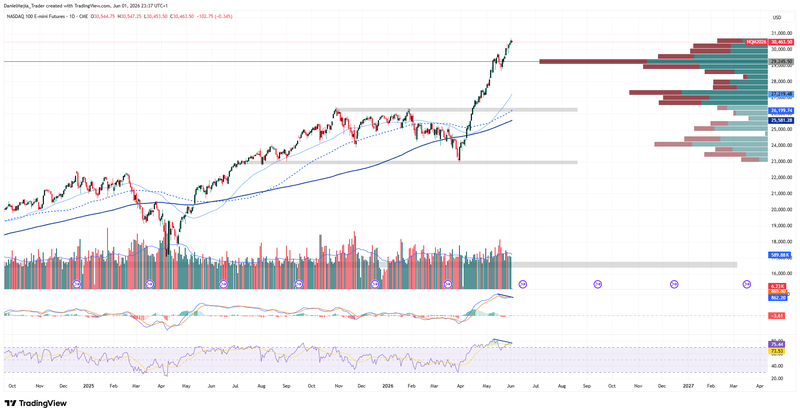
Figure 1. Nasdaq Future Contract (2025–2026). Source: Data from the CME Group; Own analysis conducted via TradingView.


