
 Help
Help Nasdaq slips on renewed AI valuation concerns and geopolitical instability
The Nasdaq futures contract retreated by 1.81% to close at 29, 392 points, as market participants increasingly scrutinised elevated artificial intelligence (AI) valuations. Concurrently, a sharp escalation in Middle Eastern geopolitical tensions drove crude oil prices higher, stoking market expectations of a more hawkish monetary policy stance from the Federal Reserve.
Growing apprehension over premium tech sector valuations prompted a wave of risk aversion targeting high-growth equities.
Disruptions and projectile attacks targeting tankers in the strategically vital Strait of Hormuz propelled crude oil benchmarks upward by approximately 3%.
Market-implied probabilities for a 25-basis-point Federal Reserve interest rate hike in September climbed to a peak of 52.7%.
Nasdaq under pressure from AI valuation worries and geopolitical uncertainty
The Nasdaq futures contract (NQU6) declined by 1.81% to settle at 29,392 points, weighed down by a confluence of renewed anxieties regarding overextended valuations among artificial intelligence (AI)-related firms and compounding geopolitical frictions in the Middle East. Against this backdrop, institutional investors have begun questioning the long-term sustainability of the AI-stocks rally that has previously propelled technology benchmarks to record highs. This reassessment has triggered a rotating, more risk-averse stance toward growth-oriented sectors.
According to reports from Reuters, Qatar attributed blame to Iran following attacks on commercial tankers within the Strait of Hormuz. Simultaneously, US administration officials intensified diplomatic pressure, stating that a comprehensive security agreement must be reached, or the United States would "finish the job"—rhetoric that market participants interpreted as a signal of potential military intervention. In response to these supply-side threats, the Brent crude futures contract (BRNU6) advanced by 3.01% to $74.16 per barrel, while the West Texas Intermediate (WTI) futures contract (CLQ6) climbed 2.70% to close at $70.39 per barrel.
In the wake of this commodity spike, the CME FedWatch Tool indicated that fixed-income markets are rapidly pricing in tighter monetary conditions. The market-implied probability of a 25-basis-point interest rate increase at the Federal Reserve's September meeting rose to 52.7%. Furthermore, the tool assigned a 33.1% probability to a subsequent interest rate hike by the December meeting. Reflecting this hawkish repricing, the US 10-year Treasury yield surged by roughly 8 basis points to 4.55%. This adjustment suggests that market participants increasingly believe that localized geopolitical instability could translate into broader, energy-driven inflationary pressures, thereby complicating the Federal Reserve's near-term monetary policy trajectory.
Ultimately, the combination of structural valuation concerns within the tech sector, renewed maritime frictions, and the rising likelihood of a restrictive policy stance by the US central bank collectively depressed broader market sentiment across the Nasdaq benchmark.
Technical analysis of the Nasdaq futures contract
From a technical perspective, the Nasdaq index maintains a structurally sound, long-term bullish trajectory. However, a granular assessment of the daily charts reveals several shifting momentum dynamics:
- Trend Context: In the long term, the Nasdaq exhibits a classic ascending configuration, structurally defined by a sequence of higher highs and higher lows. The index continues to trade comfortably above its 50-day, 100-day, and 200-day Simple Moving Averages (SMAs). Yet, while the intermediate trend remains upwardly aligned, short-term momentum oscillators are actively tracing downward trajectories, pointing to a distinct deceleration in the underlying bullish impulse.
- Resistance Levels: Should the index reverse its immediate decline and resume its upward extension, the primary structural milestone resides at the historical record high of 30,875 points. Beyond this level, the next psychological barrier is identified at the 32,000 mark. A clean breakout above these thresholds would initiate a new phase of price discovery within uncharted territory.
- Support Levels: In the event of a near-term extension of the current retracement, immediate localized support is anchored at 28,300 points. If this threshold is invalidated on a closing basis, the next critical structural floor is located at 26,400 points, a zone that closely converges with the ascending 200-day SMA. A decisive breach below 26,400 would significantly increase the probability of a deeper market correction.
- Momentum Indicators: Both the Moving Average Convergence Divergence (MACD) and the Relative Strength Index (RSI) are exhibiting notable bearish divergences alongside their downward paths. This technical setup strongly implies that a period of near-term market consolidation or a technical retracement is probable in the sessions ahead.
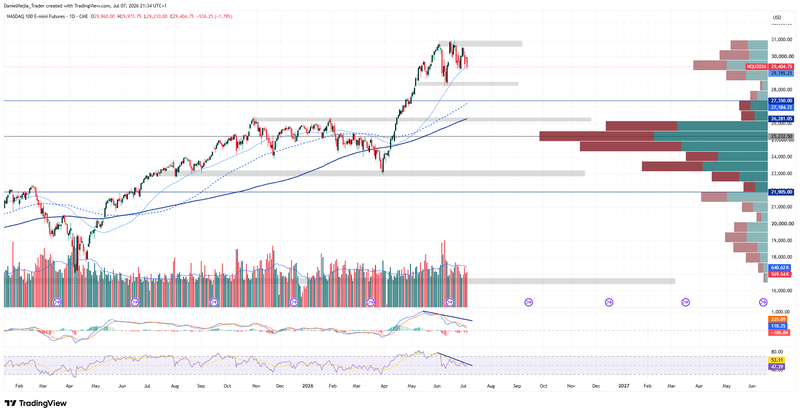
Figure 1. Nasdaq Future Contract (2025–2026). Source: Data from the CME Group; Own analysis conducted via TradingView.


