Help
Help Nasdaq under pressure as Netflix and SpaceX post steep losses
The Nasdaq declined as geopolitical tensions and sharp losses in Netflix, SpaceX, and Applied Materials weighed on market sentiment.
Nasdaq futures fell by 1.55% as US–Iran tensions increased risk aversion and pressured technology shares.
Netflix dropped by 7.26% following mixed earnings, while SpaceX fell by 5.43% after the cancellation of its Starship launch.
Applied Materials declined by 5.57%, adding to weakness across technology-related stocks.
Date: 17 July 2026
Nasdaq slides amid significant losses in Netflix and SpaceX
The Nasdaq futures contract (NQU6) declined by 1.55%, pressured by rising tensions between the United States and Iran and sharp losses among major growth-oriented companies, notably Netflix and SpaceX, both of which recorded significant declines by the market close.
Regarding the geopolitical backdrop, Reuters reported that the United States had attacked Iranian bridges and several infrastructure targets. Concurrently, Iran reportedly struck a power and desalination plant in Kuwait. In addition, an oil shipment was intercepted in the Red Sea, raising concerns that this strategic maritime route could face further disruption if Houthi forces become directly involved in the conflict. These developments heightened fears of broader instability across energy supply chains and weighed on investor sentiment, particularly towards high-growth and technology-related assets.
In terms of company-specific performance, Netflix Inc. fell by 7.26% to $68.95 after releasing a mixed set of quarterly earnings results. The streaming giant exceeded expectations for earnings per share (EPS) but fell slightly short of revenue forecasts. In addition, the company announced that it would reduce the frequency of its “What We Watched” reports, suggesting a more cautious approach to communicating future engagement trends and managing investor expectations.
Meanwhile, Space Exploration Technologies Corp. (SpaceX) declined by 5.43% to $123.99, accumulating a depreciation of approximately 27% during July. The decline followed the cancellation of its Starship mega-rocket launch after several engines failed to start, according to comments from Elon Musk quoted by CNBC. The setback added to existing selling pressure on the shares, which had already been affected by concerns over elevated valuation levels.
Additionally, Applied Materials (AMAT), with a market capitalisation of approximately $420.53 billion, fell by 5.57% to $529.66, placing further pressure on the Nasdaq during the session.
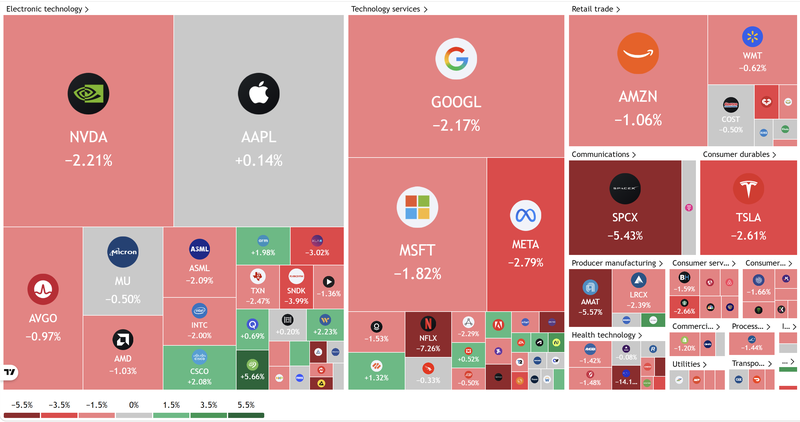
Figure 1. Nasdaq Stock Heatmap (17 July 2026). Source: Data from the Nasdaq Exchange; figure obtained from TradingView.
Technical analysis of the Nasdaq futures contract
From a technical perspective, the Nasdaq futures contract maintains a structurally long-term bullish trajectory. However, a detailed assessment of the chart reveals several shifts in momentum dynamics:
- Trend context: Over the long term, the Nasdaq exhibits a classic ascending structure, defined by a sequence of higher highs and higher lows. The contract continues to trade comfortably above its 100-day and 200-day Simple Moving Averages (SMAs). Nevertheless, although the intermediate trend remains upward, short-term momentum oscillators are following downward trajectories, pointing to a clear deceleration in the underlying bullish impulse.
- Resistance levels: Should the contract reverse its immediate decline and resume its upward movement, the primary structural milestone would be the record high of 30,875 points. Beyond this level, the next psychological barrier is identified at the 32,000 mark. A decisive breakout above these thresholds would initiate a new phase of price discovery in uncharted territory.
- Support levels: If the current retracement extends in the near term, immediate support is located at 28,300 points. If this threshold is invalidated, the next critical structural floor would be situated at 26,400 points, a zone that closely converges with the ascending 200-day SMA. A decisive breach below 26,400 would significantly increase the probability of a deeper market correction.
- Momentum indicators: Both the Moving Average Convergence Divergence (MACD) and the Relative Strength Index (RSI) are exhibiting downward trajectories. In particular, the MACD is close to crossing the zero line to the downside, which could signal a strengthening of the short-term bearish trend. This technical configuration suggests that a period of near-term market consolidation or a technical retracement is likely over the coming sessions, although fundamental factors are expected to predominate over the underlying market structure.
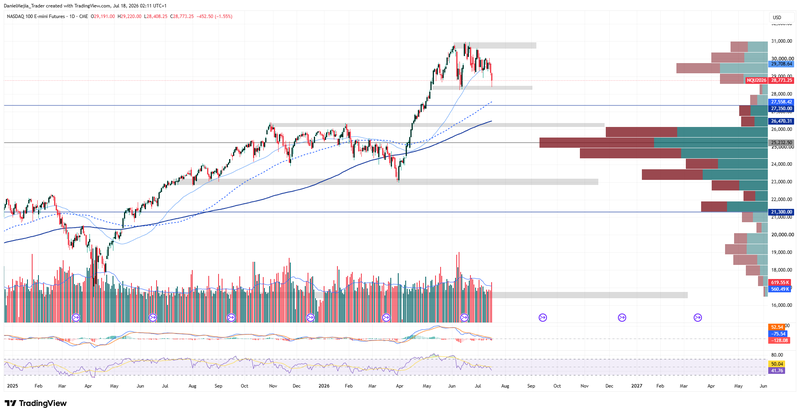
Figure 2. Nasdaq Futures Contract (2025–2026). Source: Data from CME Group; own analysis conducted via TradingView.