Help
Nikkei 225 declines as Japan's industrial output and retail sales slow
The Nikkei 225 index dropped by 2.12% following a deceleration in Japan's industrial output and retail sales. However, despite short-term selling pressure, the index retains its long-term bullish momentum.

Data from the Ministry of Economy, Trade and Industry (METI) reveals that Japan’s year-on-year (YoY) industrial output growth slowed to 1.9% in September from 2.7% in August.
Retail sales fell by 0.7% month-on-month in September, easing annual growth down to 2.3%.
Higher interest rates and elevated energy costs continue to tighten credit, dampening consumer purchasing power.
The Bank of Japan (BoJ) maintained its benchmark interest rate at 1.25% amid mounting inflationary pressures.
Date: 31 October 2026 (GMT+3)
Is Japan's economic slowdown putting pressure on the Nikkei 225?
According to data released by Japan's Ministry of Economy, Trade and Industry (METI), year-on-year industrial production growth decelerated from 2.7% in August to 1.9% in September. Furthermore, the METI report revealed that retail sales contracted by 0.7% on a monthly basis in September, resulting in a deceleration in annual growth from 2.9% to 2.3%.
Although overall industrial output and retail consumption remain in growth territory, these latest figures indicate an underlying deceleration across both metrics, suggesting that economic activity in Japan may be easing as credit conditions tighten.
Against this backdrop, the Bank of Japan (BoJ) has adopted a more hawkish monetary policy stance, implementing a series of interest rate hikes over the past three years—though it opted to hold its benchmark interest rate steady at 1.25% during its most recent policy meeting. The BoJ faces sustained pressure from rising inflation rates driven by higher energy prices. Consequently, despite government subsidies, the cost of living for Japanese households has deteriorated.
Elevated interest rates tend to tighten credit conditions for both producers and consumers, which may be weighing on productivity and consumption as industrial output and retail sales moderate.
As a result, the Nikkei 225 stock index fell by 2.12% to close at 63,289 points. Notably, while the index maintains its long-term bullish momentum, it is currently experiencing pronounced selling pressure in the short term.
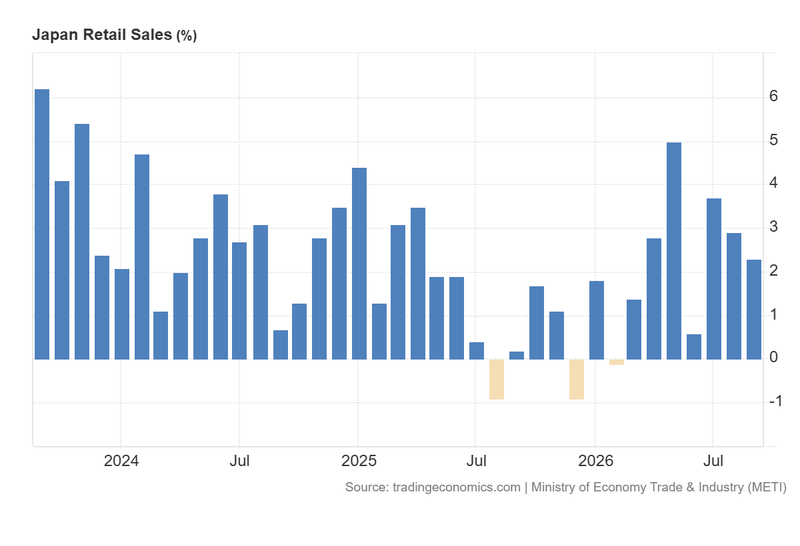
Figure 1. Japan Retail Sales (2023–2026). Source: Data from the Ministry of Economy, Trade and Industry (METI); chart retrieved via Trading Economics.
Technical analysis of the Nikkei 225 index
From a technical perspective, the Nikkei 225 continues to display a robust long-term bullish trajectory. A detailed analysis of the current market structure reveals the following key observations:
- Trend Context: Over the long term, the index remains firmly in an uptrend, characterised by a structural sequence of higher highs and higher lows. It is currently trading above its 200-day Simple Moving Average (SMA), confirming that broader bullish momentum remains in force. However, a range-bound consolidation pattern has dominated recent price action, whilst substantial selling pressure over recent weeks has caused the index to break below its 50-day and 100-day SMAs. Additionally, the Nikkei is breaching a long-term bullish channel to the downside and is testing its 200-day SMA as a key support level.
- Momentum Indicators: Both the Moving Average Convergence Divergence (MACD) and the Relative Strength Index (RSI) are trending neutrally, indicating a lack of clear market direction in the short term.
- Resistance Levels: Should the index breach the immediate resistance level near 64,800 to the upside, the next significant technical resistance lies at 66,483 (where the 50-day and 100-day SMAs converge), followed by the technical ceiling at 72,400 (its record high).
- Support Levels: Should the support level at 61,780 (the 200-day SMA) be breached to the downside, the immediate short-term structural floor is situated at 60,000 points—a major psychological barrier that aligns with prominent structural support. If this level fails to hold, the subsequent structural support area lies at 52,500 points.
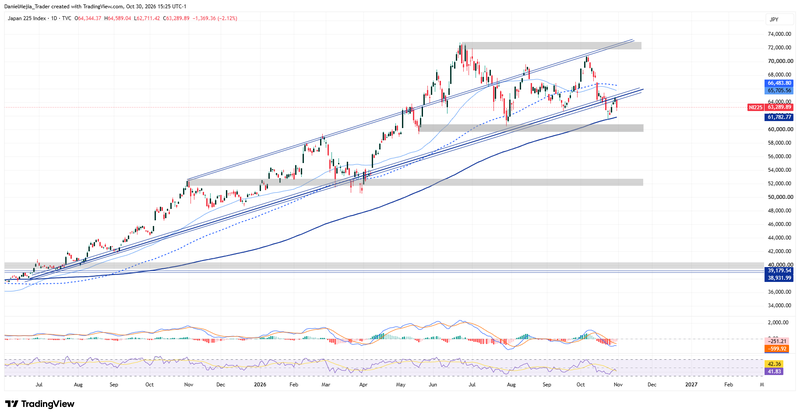
Figure 2. Nikkei 225 Index (2025–2026). Source: Analysis conducted via TradingView.