Help
Nikkei 225 tests key support level as Japan's trade balance weakens
Japan’s widening trade deficit and rising energy costs exert pressure on the Nikkei 225 towards key support at 64,100 points, as export weakness and geopolitical tensions undermine fundamental macroeconomic confidence in Japanese equities.

September Japan's trade deficit widened to ¥536.6 billion, missing analysts' forecasts of an ¥181 billion contraction.
Exports grew by 16.7% to ¥10,972.2 billion, falling short of the forecasted 20.1% growth owing to weak global demand.
Escalating Middle East tensions drove crude oil imports up by 51.1%, placing severe pressure on energy-dependent Japan.
Doubts surrounding artificial intelligence (AI) valuations, substantial sovereign debt, and structural growth hurdles continue to weigh on Japanese equities.
Date: 22 October 2026 (GMT+3)
Is Japan's trade weakness weighing on the Nikkei 225?
According to data released by Japan's Ministry of Finance, the trade balance registered a deficit of ¥536.6 billion in September—a contraction exceeding the ¥181 billion deficit expected by analysts. This trade deficit was driven primarily by lower-than-expected export growth, which advanced by 16.7% to ¥10,972.2 billion (below the forecasted 20.1%), whilst imports increased by 18.9% to ¥11,508.8 billion (slightly below the expected 19.6%).
Consequently, the trade balance has recorded five consecutive months in deficit. Notably, crude oil imports jumped by 51.1%—as cited by Trading Economics. This challenging performance unfolds as escalating geopolitical tensions in the Middle East continue to disrupt energy flows to Japan, a nation highly dependent on crude oil imports.
Following the publication of these economic data, the Nikkei 225 stock index tested a significant support area near 64,100 points. This market response comes as investors express heightened concern over Japan's subdued macroeconomic performance, coupled with lingering doubts regarding the sustainability of artificial intelligence (AI)-related market capitalisations.
Japan remains a major industrial power in the global economy, having maintained a sharp focus on technology and innovation over recent decades. However, persistent headwinds to economic growth, sovereign debt concerns, and geopolitical pressures in the Middle East have destabilised macroeconomic indicators, potentially casting a shadow over the ahead outlook for Japanese equities.
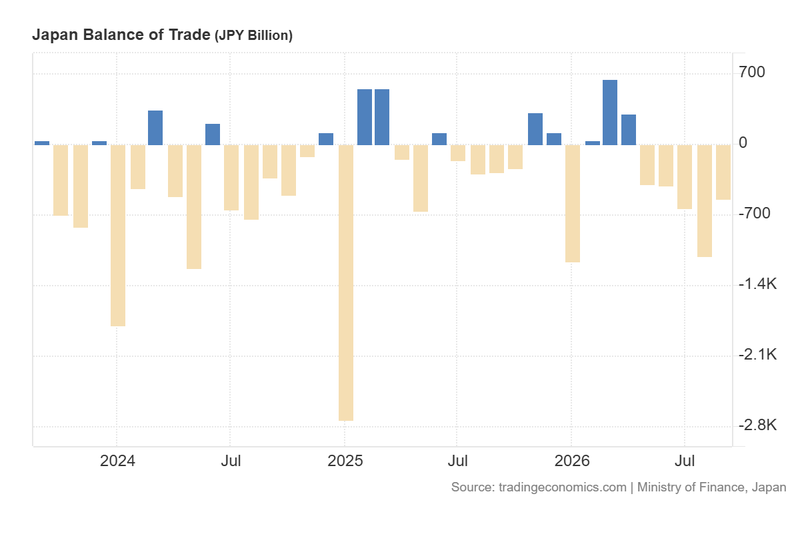
Figure 1. Japan Balance of Trade (2023–2026). Source: Data from the Ministry of Finance of Japan; figure retrieved from Trading Economics.
Technical analysis of the Nikkei 225 index
From a technical perspective, the Nikkei 225 continues to display a robust long-term bullish trajectory. A detailed analysis of the current market structure reveals the following key observations:
- Trend Context: Over the long term, the index remains firmly in an uptrend, characterised by a structural sequence of higher highs and higher lows. It is currently trading comfortably above its 200-day Simple Moving Average (SMA), confirming that the broader bullish momentum remains intact. However, a range-bound consolidation pattern has dominated recent price action, whilst substantial selling pressure over recent weeks has caused the index to break below its 50-day and 100-day SMAs. Currently, the index is testing the floor of a long-term bullish channel—a key technical support level within its market structure.
- Momentum Indicators: Both the Moving Average Convergence Divergence (MACD) and the Relative Strength Index (RSI) are trending downwards, suggesting that short-term bearish pressure may persist.
- Resistance Levels: Should the index hold and rebound from the 64,100 support level, two prominent resistance levels lie at 67,300 and 72,300 points—the latter representing the record all-time high.
- Support Levels: Should the 64,100 support level be breached to the downside, the immediate short-term structural floor is located at 61,000 points—where key horizontal support converges with the 200-day SMA. If this floor fails to hold, the next structural support area lies at 52,500 points.
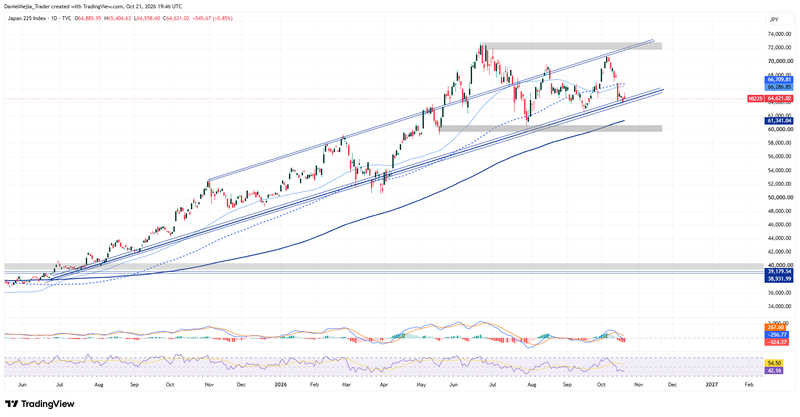
Figure 2. Nikkei 225 Index (2025–2026). Source: Analysis conducted via TradingView.