Nikkei reaches new record as BoJ intensifies its restrictive stance
The Nikkei 225 achieved a fresh record high after the Bank of Japan raised interest rates to 1%, marking its highest borrowing cost since 1995 and signalled potential further tightening to contain persistent inflationary pressures. Despite this hawkish policy stance, equities advanced.

The BoJ increased its policy rate by 25 basis points to 1.0%, reaching a level not seen since 1995, while leaving the door open to further monetary tightening.
Officials noted that inflation remains stubborn, with producer prices climbing to 6.3%, increasing the risk of subsequent cost pass-through to consumers.
The Nikkei 225 rose 0.22% to close at 69,420 points, securing a historic high despite the central bank's shift toward a more restrictive stance.
Technically, the broader upward trajectory remains intact; however, overbought indicators and a bearish MACD divergence warn of a potential short-term market retracement or consolidation phase.
Bank of Japan increases rates, leaving door open to additional tightening
The Bank of Japan (BoJ) decided to increase its benchmark interest rate by 25 basis points, moving from 0.75% to 1%, in line with market expectations. The current level represents the highest policy rate since September 1995, reflecting a significant milestone that could notably impact credit conditions across the Japanese economy. The Policy Board’s decision was nearly unanimous, passing with a 7–1 majority vote; the sole dissenting member cited outstanding risks to domestic production and employment. Broadly, policymakers indicated that they remain prepared to continue raising interest rates as required, closely monitoring prevailing economic conditions and the development of underlying inflationary forces in subsequent periods. Notably, the BoJ emphasised its strict focus on price pressures, reaffirming that the institution will not permit protracted inflation overshoots beyond its formal 2% target.
Additionally, while the BoJ’s Board indicated that the recent US-Iran peace agreement was a welcome development expected to facilitate inflation normalisation, it cautioned that domestic price pressures remain persistent. Corporate inflation pressures could eventually be transferred to end consumers. This concern is underscored by the current Producer Price Index (PPI), which stands at 6.3%, its highest level since March 2023.
Following the monetary policy announcement, the Nikkei 225 stock index rose marginally by 0.22% to close at 69,420 points, establishing a new record high. This positive market reaction contrasted with the traditional contractionary response typically observed during central bank monetary tightening cycles.
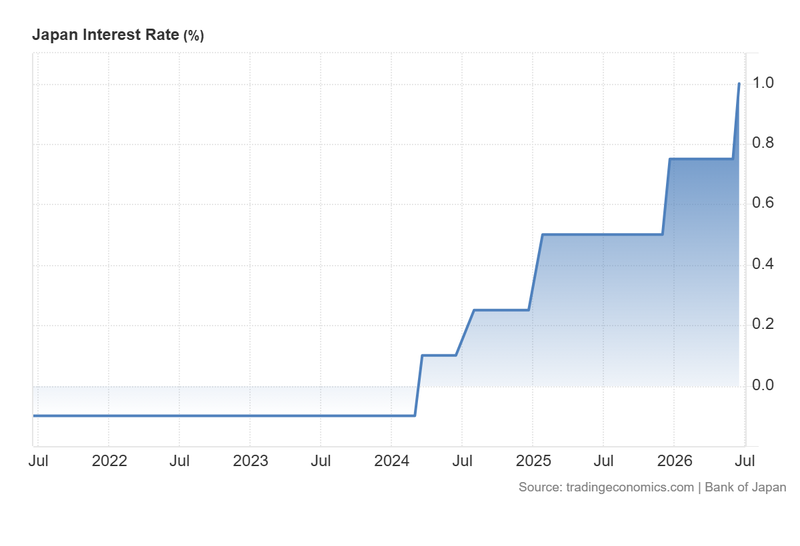
Figure 1. Japan Interest Rate (2021–2026). Source: Data from the Bank of Japan; figure obtained from Trading Economics.
Technical analysis of the Nikkei 225 index
From a technical perspective, the Nikkei 225 continues to display a robust long-term bullish trajectory. A detailed analysis of the current market structure reveals the following key observations:
- Trend Context: Over the long term, the index remains locked in a clear uptrend, characterised by a structural sequence of higher highs and higher lows. It is currently trading comfortably above its 50-day, 100-day, and 200-day Simple Moving Averages (SMAs), confirming strong underlying momentum.
- Resistance Levels: Should the index maintain its current bullish momentum, the next significant technical barrier will be the prominent psychological threshold of 70,000 points. A decisive close above this level would signal the potential for further extensions into uncharted price territory, with the 72,000 mark acting as the subsequent relevant level.
- Support Levels: In the event that the index experiences a market retracement, immediate short-term support is located at 68,400 points. If this floor is invalidated, the next critical structural support lies at 63,000 points. A breach of the 63,000 zone would significantly heighten the probability of a deeper market correction.
- Momentum Indicators: Both the Moving Average Convergence Divergence (MACD) and the Relative Strength Index (RSI) are currently trading in overbought territory, suggesting that a short-term retracement or consolidation phase may unfold. Additionally, the MACD is exhibiting a bearish divergence, reinforcing the hypothesis that a short-term market contraction could materialize.
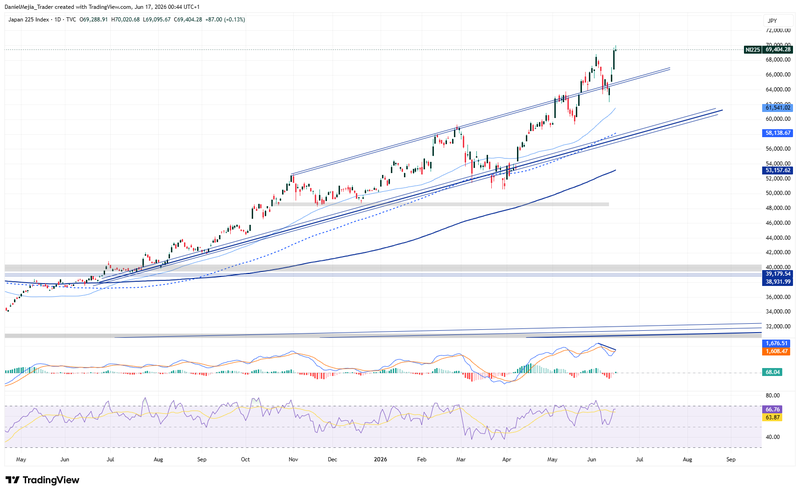
Figure 2. Nikkei 225 Index (2025–2026). Source: Own analysis conducted via TradingView.


