Nikkei under pressure amid rising producer prices and geopolitical instability
Japan’s Nikkei 225 retreated as producer prices surged to their highest level since March 2023, increasing pressure on the Bank of Japan amid yen weakness above ¥160 per dollar. Escalating tensions in the Middle East also weighed on market sentiment.

Japan’s PPI jumped to 6.9% in May, the highest level since March 2023, driven mainly by higher energy costs.
The yen’s position above ¥160 added pressure on the Bank of Japan, as imported inflation and currency weakness complicate policy decisions.
The Nikkei has fallen by around 3% over the last two sessions as inflation and Middle East risks have weighed on sentiment.
Japan’s PPI climbs to its highest level since March 2023
The benchmark Nikkei 225 index closed with a market retracement driven by higher producer inflation and geopolitical instability in the Middle East.
According to data from the Bank of Japan (BoJ), the producer price index (PPI) accelerated sharply from 5.3% in April to 6.9% in May, exceeding analysts’ expectations of a rise to 5.5%. The latest reading marks the highest level since March 2023 and was driven primarily by higher energy prices—a significant consequence of the US–Israel–Iran conflict in the Middle East. On a monthly basis, the PPI increased by 0.9%, above the market forecast of 0.5%. Consequently, the BoJ is facing dual pressure from rising inflation and continued depreciation of the Japanese yen, which is currently trading above the ¥160 threshold against the US dollar.
In addition, according to Reuters, US President Donald Trump stated that the United States would attack Iran again “very hard” if a peace agreement with Tehran were not reached. Hours after Trump’s statement, media outlets such as France 24 reported that the US had resumed its attacks against Iran, while Tehran had ordered the complete closure of the Strait of Hormuz. Concurrently, bilateral strikes between Israel and Hezbollah continued, reflecting the pronounced fragility of the previous ceasefire agreement between the parties involved.
Against this backdrop, the Nikkei index has recorded a decline of around 3% over the last two trading sessions, fluctuating around the 63,500 level.
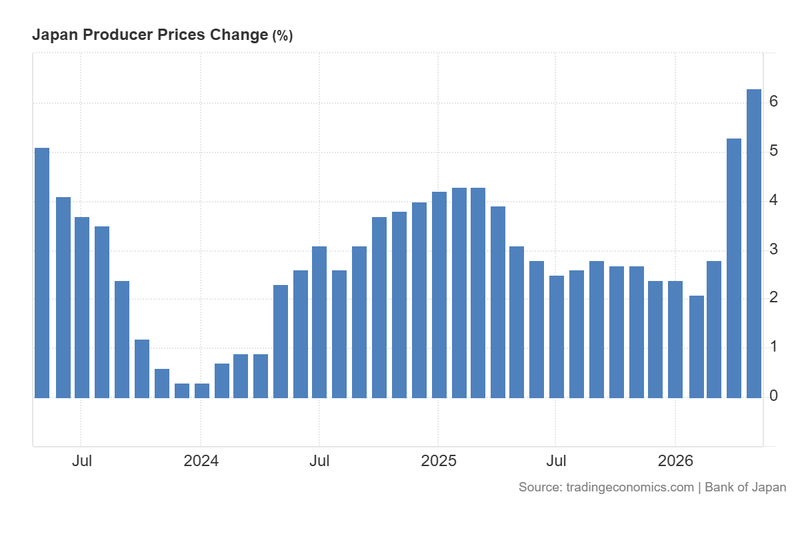
Figure 1. Japan Producer Price Index (2023–2026). Source: Data from the Bank of Japan; figure obtained from Trading Economics.
Technical analysis of the Nikkei 225 index
From a technical perspective, the Nikkei 225 continues to display a robust long-term bullish trajectory. A detailed analysis of the current market structure reveals the following key observations:
- Trend context: Over the long term, the index remains in a clear uptrend, characterised by a structural sequence of higher highs and higher lows. It is currently trading comfortably above its 50-day, 100-day, and 200-day Simple Moving Averages (SMAs), confirming strong underlying momentum. However, short-term momentum indicators are retreating from overbought territory.
- Resistance levels: Should the index surpass its record high of 68,370 points, the next significant technical level would be the prominent psychological threshold of 70,000 points. A decisive close above this level would signal the potential for a further extension into uncharted price territory.
- Support levels: In the event that the index continues its current retracement, immediate support is located at 63,250 points. If this short-term support is invalidated, the next critical floor lies at 59,500 points. A breach of the 59,500 zone would significantly increase the probability of a deeper market correction.
- Momentum indicators: Both the Moving Average Convergence Divergence (MACD) and the Relative Strength Index (RSI) are currently retreating from overbought territory, suggesting that a short-term retracement or consolidation phase may continue. The MACD is also exhibiting a bearish crossover from elevated levels.
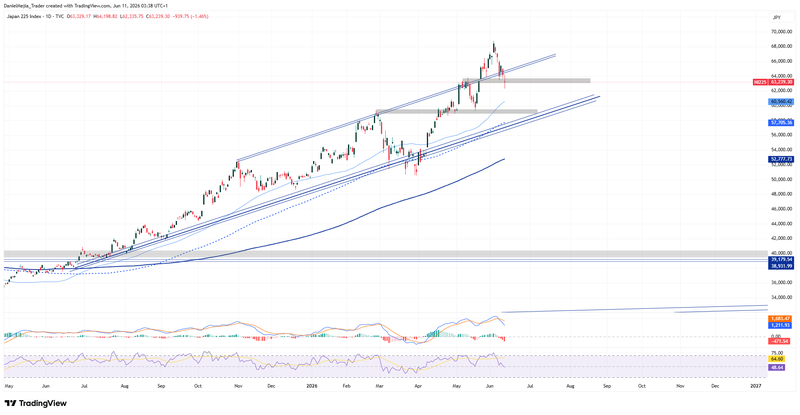
Figure 2. Nikkei 225 Index (2025–2026). Source: Own analysis conducted via TradingView.


