Help
Help 
Silver’s next move may depend on the $70 breakout
The comparison with 2011 is not about repeating the same price action. It is about the same question returning to the market: what happens when confidence in Washington's debt strategy begins to weaken? That question carries more weight today than it did fifteen years ago. U.S. debt has climbed from roughly $14.8 trillion in 2011 to more than $40 trillion, and policymakers are once again looking for ways to ease pressure on government borrowing costs.
U.S. debt has grown from about $14.8 trillion in 2011 to more than $40 trillion today.
Treasury buybacks have pushed yields lower, improving the backdrop for precious metals.
The $69-71 area has become the market's biggest technical test in months.
Silver's is reviving a trade last seen in 2011
Silver is approaching a level that is starting to feel familiar. The market is not revisiting 2011 because history is repeating itself exactly. It is because investors are asking the same question they asked back then: what happens when confidence in the government's debt strategy begins to weaken?
That question has become harder to ignore as U.S. debt has climbed from roughly $14.8 trillion in 2011 to more than $40 trillion today. The response has also evolved. Fifteen years ago, the Federal Reserve flooded the system with liquidity through quantitative easing. Today, Washington is leaning on Treasury buybacks to ease pressure on long-term borrowing costs. The tools are different. The objective looks increasingly similar.
Silver has responded in a familiar way
Gold moved first, as it often does when investors become more defensive. Silver spent months lagging before beginning to close the gap, a pattern that has appeared repeatedly during major precious metal cycles. That is why traders are paying close attention to the $70 area. It is becoming more than at another price level. It is the point where the market starts asking whether silver is moving from catching up with gold to leading its own rally.
The backdrop also looks different from earlier phases of the move
Central banks continue buying gold, investors are returning to precious-metals ETFs, and the bond market has become increasingly sensitive to Washington's growing financing needs. Lower Treasury yields have made holding precious metals easier to justify, while concerns about long-term fiscal sustainability have kept demand for hard assets alive even as other markets remain near record highs.
Technical outlook
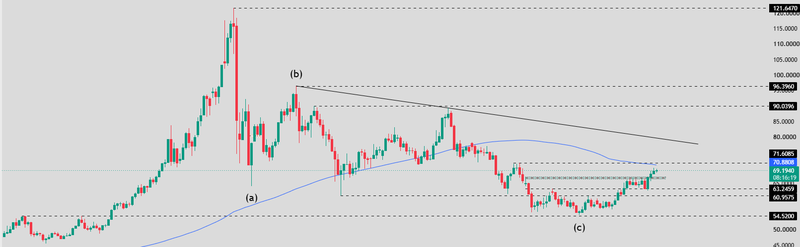
Silver has started looking different after months of trading on the back foot. Since falling from the 121.65 peak, every rally had been capped by the same descending trendline. That ceiling is still there, but the latest recovery from the 54.50 low has changed the rhythm of the market. Buyers are no longer chasing brief rebounds they are defending higher levels as the recovery develops.
The next test is already in front of the market
Silver is trading around 69.20, right below the 69-71 resistance zone, where the 126-day moving average near 70.88 and horizontal resistance around 71.60 come together. This is the kind of area where rallies often slow down because both buyers and sellers have reasons to become more active.
The structure underneath the market has also improved. The 60.95-63.25 area has absorbed several pullbacks, giving buyers a stronger base than they had earlier in the correction. That has allowed silver to keep working toward higher resistance instead of slipping back to fresh lows.
The bigger trend has not changed yet. The long-term descending trendline from the 121.65 high is still in place, so silver has not fully broken away from the correction. But it has reached the point where a convincing move through the 69-71 zone would leave the market looking very different from the one that struggled through the first half of the year.
Source: Trading view
Scenario ahead
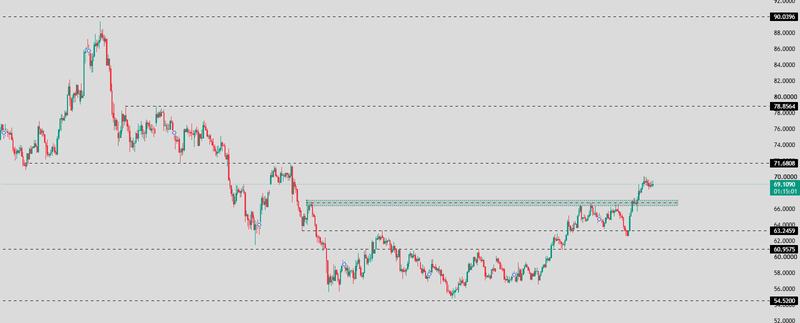
Silver has reached one of its biggest technical tests in months. The recovery from 54.52 has changed the rhythm of the chart, with buyers defending higher levels instead of allowing the market to slip back into the previous downtrend. The move above 63.25 strengthened that recovery, and price is now holding around 69.20, only a short distance from the 71.68 resistance that stands in the way of the next leg higher.
That is the level traders are watching now
If silver can push through 71.68 and stay above it, the recovery starts looking much more convincing. The next area on the chart sits near 78.86, where selling appeared during an earlier phase of the decline. Above that, 90.04 becomes the next longer-term reference point if momentum keeps building and the precious metal trade continues attracting buyers.
A pause here would not change the picture immediately. The 66-67 area has become the first place where buyers can show they are still in control after the breakout. If that support gives way, attention shifts back to 63.25, which has already held through earlier pullbacks.
The bigger warning sign sits at 60.96. A move below that level would break the pattern of higher lows that has supported the recovery so far and bring the 54.52 low back into focus. Until then, the chart continues to favor buyers, but the market is entering the kind of resistance zone that often decides whether a recovery becomes a broader trend or runs out of momentum.
Source: Trading view