Help
Help S&P 500 reaches record high amid strong corporate earnings
The S&P 500 reached a record high of 7,736 points after climbing 1.79%, buoyed by robust corporate earnings.
Strong corporate earnings drove the S&P 500 index up 1.79% to close at a new record high of 7,736 points.
Palantir surged 29.45%, accompanied by solid earnings beats from Caterpillar; post-close reports from AMD and SpaceX further fuelled market optimism.
Technical indicators maintain a primary bullish bias, with the index trading comfortably above key moving averages.
Date: 4 August 2026
Solid corporate earnings lift S&P 500 to record high
The S&P 500 index increased by 1.79% to close at 7,736 points amid solid corporate earnings results, thereby achieving a new record high level.
One of the most notable market performers was Palantir Technologies, whose shares jumped by 29.45% to $162.66. The company achieved total revenue and earnings per share (EPS) well above market expectations, generating a year-on-year (YoY) revenue growth rate of 94% and a YoY increase of 156% in EPS. Caterpillar also delivered strong results, reaching a YoY revenue growth rate of 23.9% as well as a YoY increase of 73% in EPS. Consequently, Caterpillar’s shares advanced by 5.60% to close at $876.54.
Additionally, despite earnings results for AMD and SpaceX being published after the market close, both firms surpassed analysts’ expectations. Advanced Micro Devices (AMD) exceeded estimates for both revenue and EPS, generating a YoY revenue growth rate of 50.26% alongside a solid annual increase of 245% in EPS. Meanwhile, SpaceX reported both total revenue and earnings per share above market expectations. These results added further optimism to the US equity market, propelling major benchmarks—notably the S&P 500 and the Dow Jones Industrial Average—to new record highs.
Technical analysis of the S&P 500 index
From a technical perspective, the S&P 500 continues to sustain its primary long-term bullish trajectory. Key structural observations include:
- Trend Context: Over the long term, the S&P 500 maintains a robust market structure defined by a sequence of higher highs and higher lows. It trades comfortably above its 50-day, 100-day, and 200-day Simple Moving Averages (SMAs), which reinforces the prevailing bullish bias.
- Resistance Levels: Should the index continue its upward momentum, the next key level is the psychological barrier at 8,000 points, representing a prominent technical ceiling. A sustained move above this level would open the door to further expansion into uncharted territory.
- Support Levels: In the event of a market retracement, immediate support sits at 7,600 points (the previous record high). A breach of this level would significantly increase the probability of a broader correction towards the 7,280 short-term support zone.
- Momentum Indicators: The Moving Average Convergence Divergence (MACD) is exhibiting a downward trajectory, suggesting that a market retracement or consolidation phase could occur. Conversely, the Relative Strength Index (RSI) is signalling an upward trajectory, indicating that the bullish impulse could persist in the short term. Nevertheless, macroeconomic and fundamental drivers are likely to remain the primary determinants of the index's direction over coming sessions.
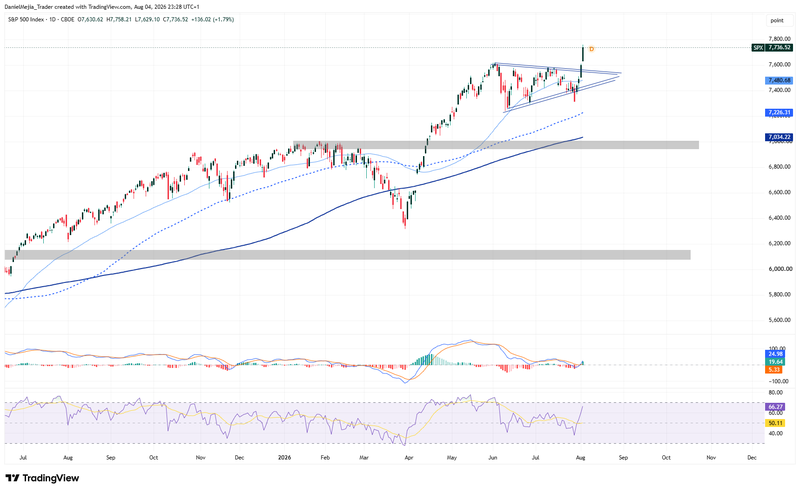
Figure 1. S&P 500 Index (2025–2026). Source: Data from the CBOE Exchange; Own analysis conducted via TradingView.